
Official websites use .gov
A .gov website belongs to an official government organization in the United States.
Secure .gov websites use HTTPS
A lock (
) or https:// means you’ve safely connected to the .gov website. Share sensitive information only on official, secure websites.

Topics
Data & Maps
Surveys & Programs
Resource Library
2015 Mover Rate Remains Near Historic Low
2015 Mover Rate Remains Near Historic Low
Given the amount of effort and planning required to move, it should come as no surprise that the vast majority of people in the United States do not move over a one-year period.
According to the U.S. Census Bureau’s 2015 Annual Social and Economic Supplement (ASEC) of the Current Population Survey (CPS), only 11.6 percent of the population age 1 and over moved between 2014 and 2015. This is not statistically different from the 2014 mover rate of 11.5 percent.
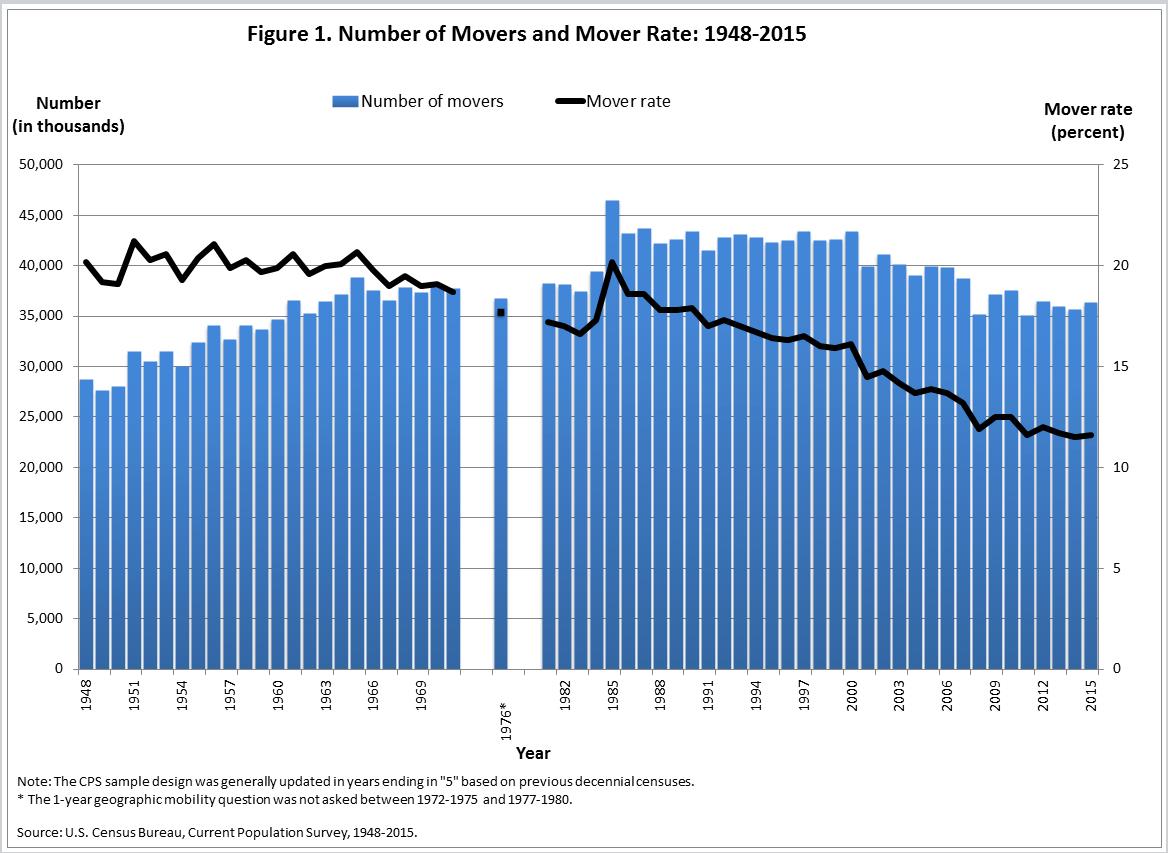
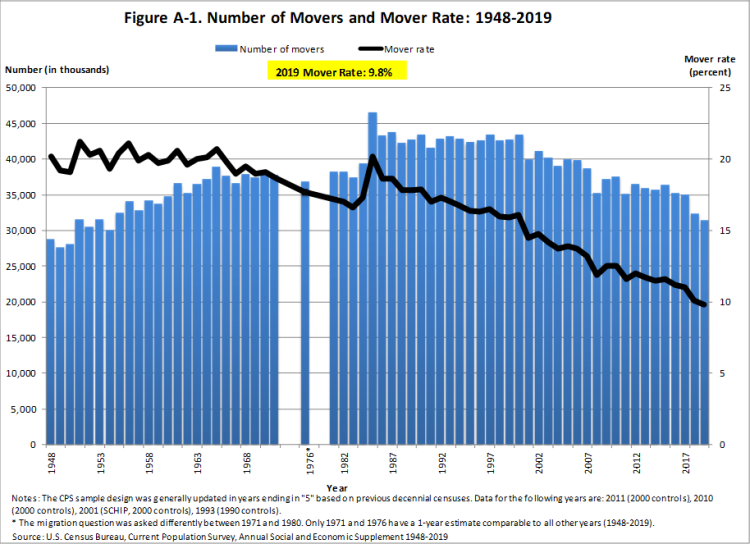
The CPS first asked about migration in 1948, a few years after the end of World War II. Historical migration rates dating back to 1948 are shown in Figure 1. The annual mover rate for 1947-1948 was 20.2 percent. Over time, the mover rate gradually declined. Rates hovered around 16 percent in the late 1990s but quickly fell to around 14 percent by the early 2000s.
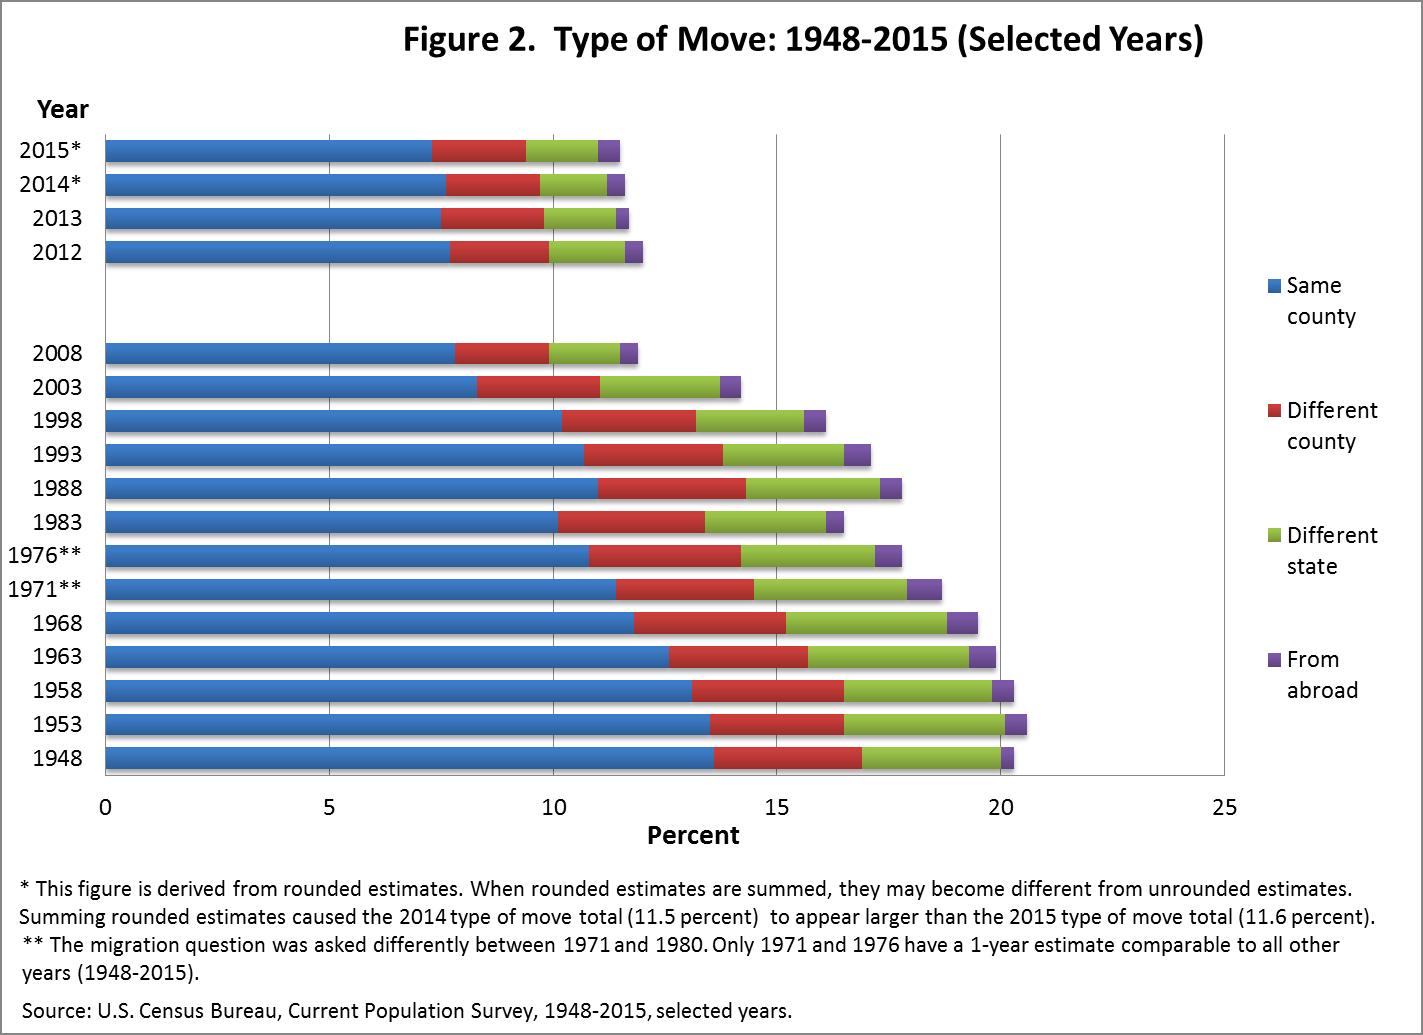
Looking at the mover rate by type of move provides valuable insight into why the mover rate has declined. As Figure 2 shows, all types of domestic moves have declined since 1948. In 1948, 13.6 percent of the population moved within the same county. Movement within the same county fell below 10 percent in 2001 and has remained below 10 percent since 2003. Recent estimates show it hovering between 7 and 8 percent. Movement to a different county within the same state was 3.3 percent in 1948 and was down to 2.1 percent in 2015. Moves to a different county in a different state were about half in 2015 from what they were in 1948 (1.6 percent and 3.1 percent, respectively). The 1948 rates for different county within the same state and different county in a different state were not significantly different. Interestingly, the percent of movers from abroad has not changed considerably over the 67 years of data collection (it was 0.3 percent in 1948 and 0.5 percent in 2015).
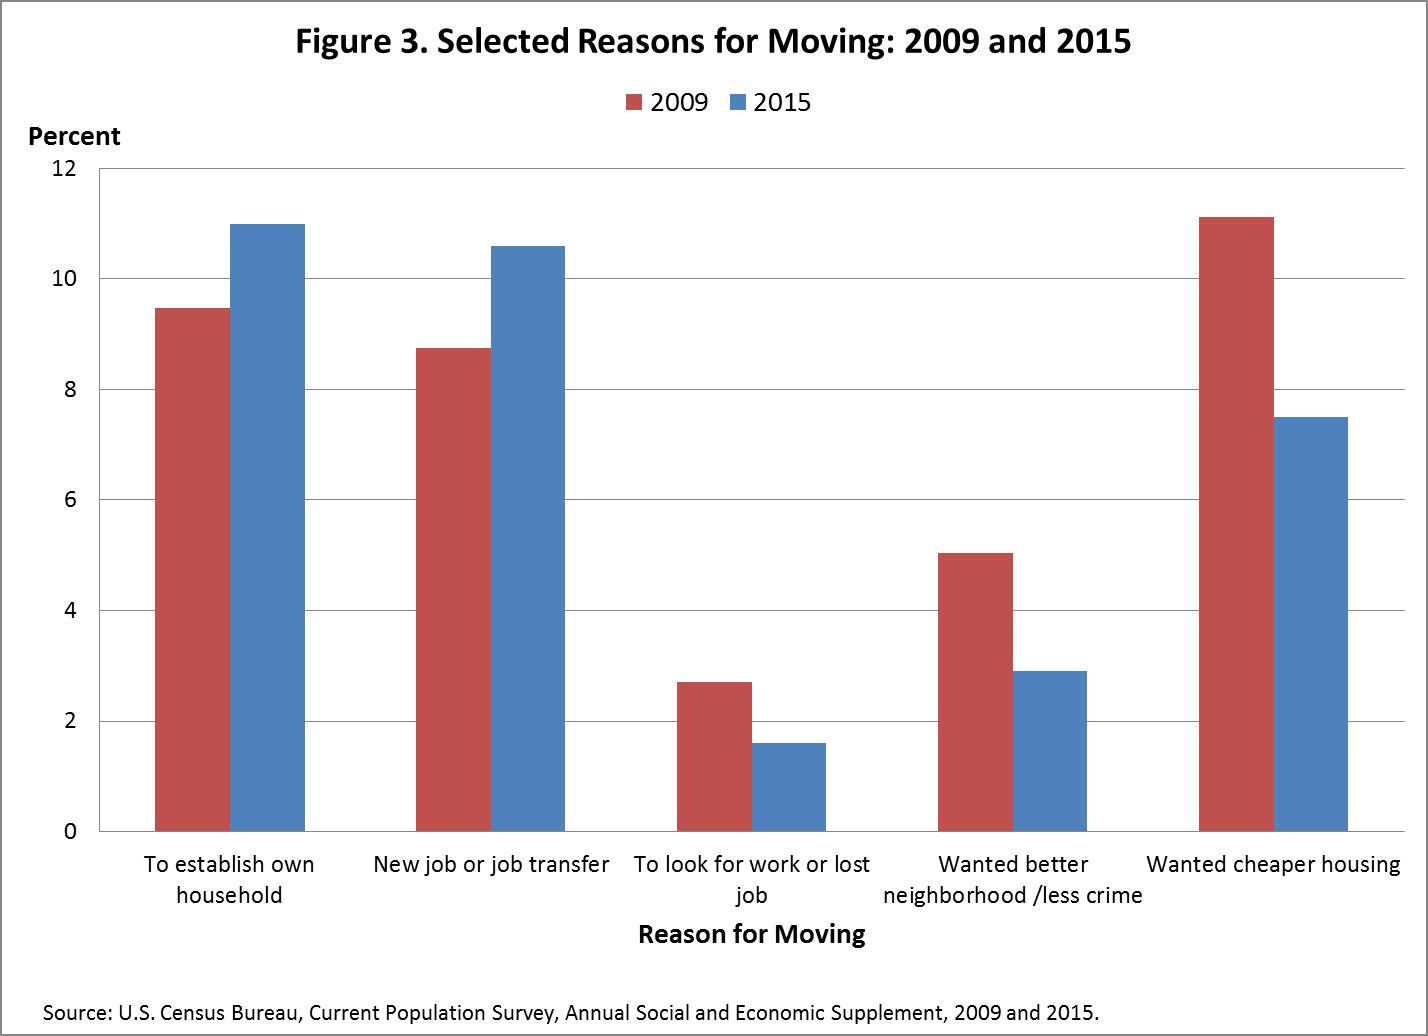
In 1999, ASEC began asking movers for their main reason for moving. While this information does not help explain the decrease in the mover rate over time, it provides valuable insight into motivating factors behind moves and how these factors have changed for the years available. For this example, we compared 2009 data when the U.S. was deeply embedded in the Great Recession with estimates from 2015. According to Figure 3, “to establish own household” and “new job or job transfer” were both more common in 2015 than 2009. “To look for work or lost job,” “wanted a better neighborhood/less crime” and “wanted cheaper housing” were more common in 2009 than 2015.
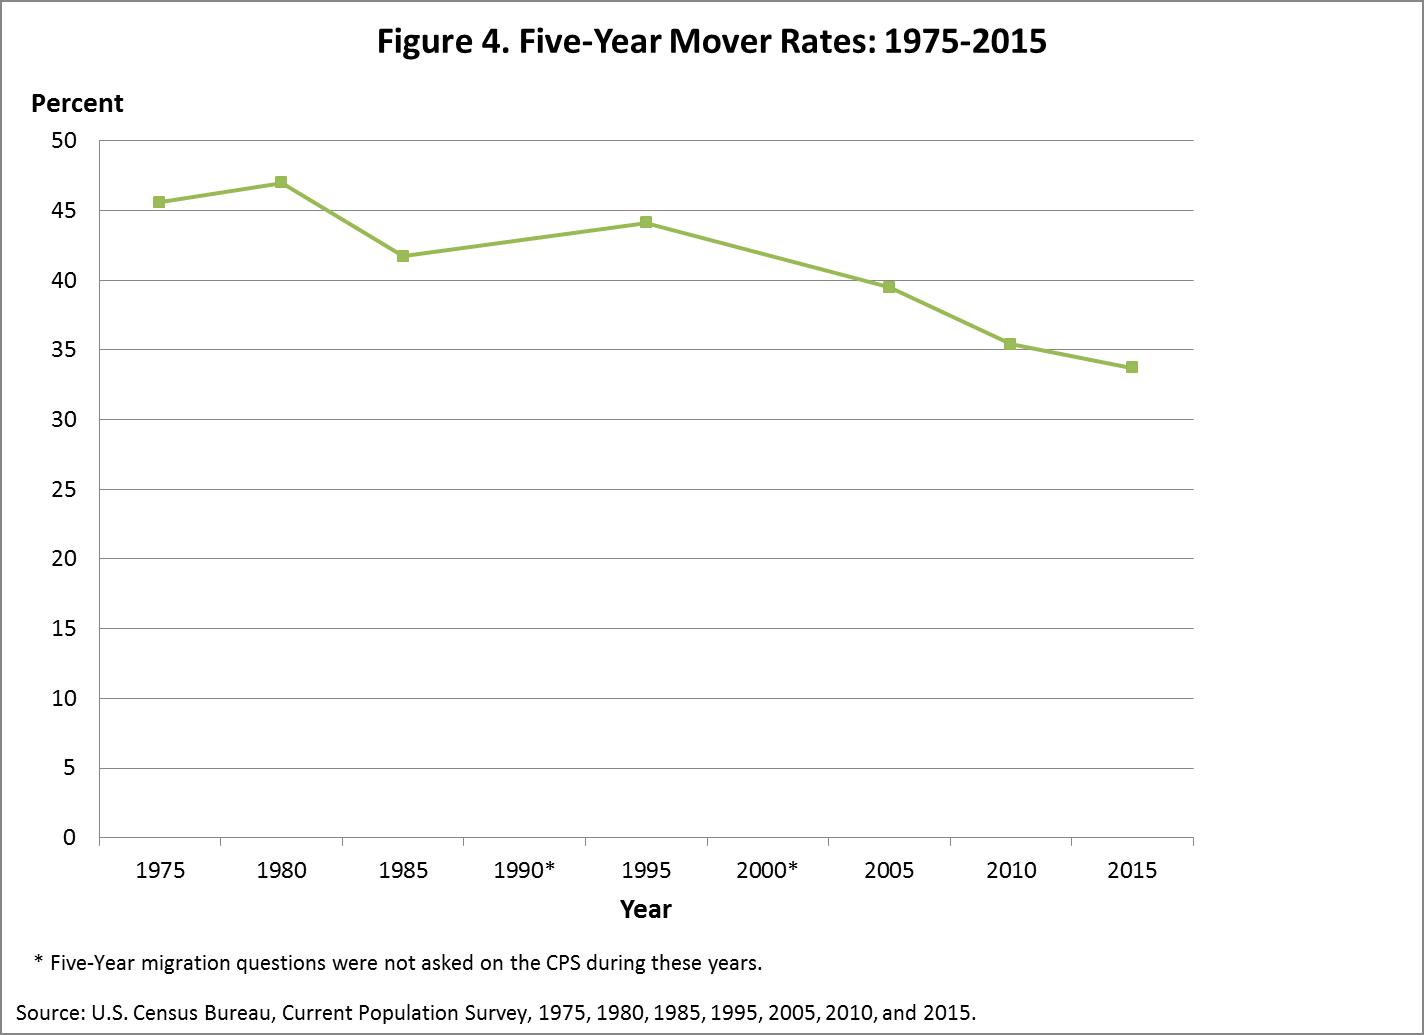
The 2015 ASEC asked additional migration questions using a five-year reference period. These five-year questions have been added every five years since 2005. Prior to 2005, they were mostly asked on years ending in “5” to serve as midway points to five-year migration estimates from decennial censuses.
Five-year migration data from the CPS provide information over a longer period, hence the rates are typically higher than one-year migration rates and show the same decline in migration that we see in the one-year question (Figure 4). The 1975 rate was 45.6 percent, the 2005 rate was 39.1 percent, and the 2015 rate was 33.7 percent.
The one-year geographical mobility detailed tables for 2015 will come out later this year. They include information on selected characteristics, such as educational attainment, labor force status, distance moved and reason for move.
For more information on migration, visit the Census Bureau’s website at //www.census.gov/hhes/migration/.
Related Information
VISUALIZATION
CPS Historical Geographic Mobility/Migration Graphs
Page Last Revised - December 16, 2021
✕
Is this page helpful?
 Yes
Yes
 No
No
 Yes
Yes
 No
No✕
NO THANKS
255 characters maximum
 255 characters maximum reached
✕
Thank you for your feedback.
Comments or suggestions?

Comments or suggestions?