An official website of the United States government
Here’s how you know
Official websites use .gov
A .gov website belongs to an official government organization in the United States.
Secure .gov websites use HTTPS
A lock (
) or https:// means you’ve safely connected to the .gov website. Share sensitive information only on official, secure websites.
-
//
- Census.gov /
- Census Blogs /
- Random Samplings /
- Working in America: New Tables Detail Demographics of Work Experience
Working in America: New Tables Detail Demographics of Work Experience
Working in America: New Tables Detail Demographics of Work Experience
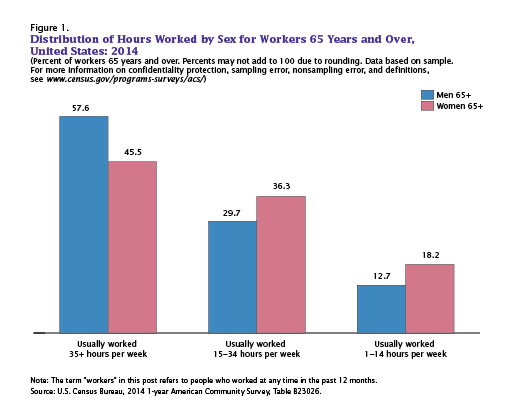
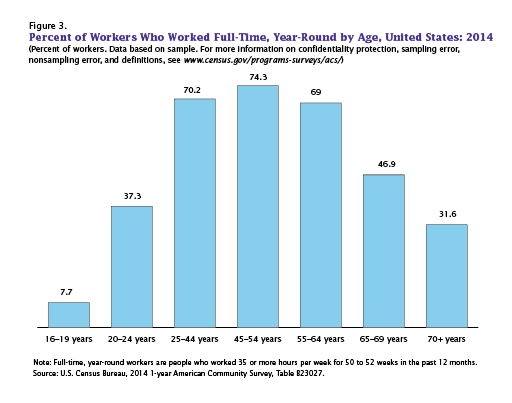
Of these older workers, many worked full time, year round; nearly half of workers age 65 to 69 and nearly a third of workers 70 and over worked full time, year round. Among workers 65 and over, men worked longer hours each week than women; 57.6 percent of men compared with 45.5 percent of women 65 and over clocked in 35 or more hours per week.
For the first time, these findings are available from the Census Bureau’s American Community Survey through American FactFinder. A variety of interesting statistics across a number of geographies are available from two new tables. The first table [AFF] (B23026) details the number of weeks worked per year and hours worked per week for men and women 65 and over (see figure 1).
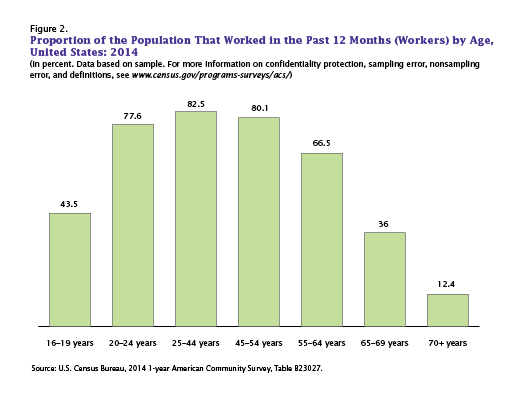
The second table [AFF] (B23027) details full-time, year-round work experience by age. Prior to the 2014 American Community Survey, data users could only see tabulated work experience information for the 16- to 64-year-old population as a whole. With this year’s data release, users are now able to obtain work experience data for detailed age groups, including the proportion of the population who worked in the past 12 months and the percentage of workers who worked full time, year round (see figures 2 and 3).
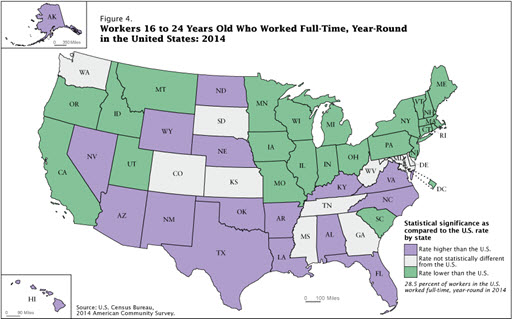
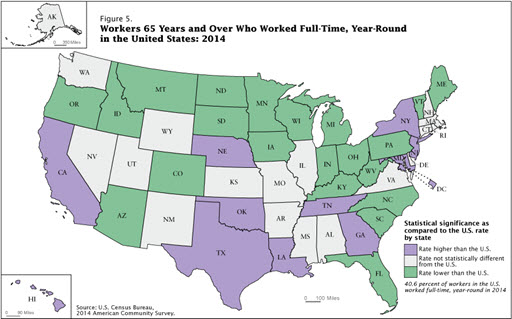
The statistics shown above are also available at a number of geographies. For example, the two maps below show full-time, year-round work status for workers age 16 to 24 (figure 4) and 65 and over (figure 5) by state. The proportion of workers 16 to 24 working full time, year round in each state ranged from 18.9 percent to 39.7 percent, with Rhode Island having one of the lowest and Alaska having one of the highest proportions. For workers 65 and over, the proportion of workers who worked full time, year round in each state ranged from 29.2 percent to 52.9 percent, with Maine having one of the lowest and Washington, D.C., having one of the highest proportions.
Share
 Yes
Yes
 No
NoComments or suggestions?


Top

