Comparison Guidance: Income and Poverty
Comparison Guidance: Income and Poverty
Last year, the U.S. Census Bureau implemented methodological changes to the 2014 Current Population Survey’s Annual Social and Economic Supplement (ASEC). Based on substantial research to improve the quality of the data we collect, we redesigned the way we asked the survey questions about income in 2014. Over the course of the past year, we evaluated the effects of the redesign and sought out experts to review and provide feedback on our efforts. Based on the results of our evaluation, we fully implemented the redesign in 2015.
Maintaining the time series means two estimates for 2013 income and poverty.
In the 2014 ASEC, we introduced the redesigned income questions using a probability split panel design. Of the 98,000 addresses selected to participate in the 2014 ASEC, approximately 68,000 addresses received the traditional set of income questions. The remaining 30,000 addresses received the redesigned income questions.
The split design functions as a bridge for year-to-year comparisons of the data. Last year, we used the traditional income questions to look at changes between 2012 and 2013. This year, we will use the estimates from the sample eligible to receive the redesigned income questions to look at changes between 2013 and 2014.
Making time series comparisons across the 2013 bridge.
For income, there were statistically significant differences for many key measures between the redesigned and traditional questions. For example, median household income calculated by using the redesigned questions was 3.2 percent higher than the median income found using the traditional questions. As a result, it is difficult to assess whether an apparent change in median household income relative to previous years was a “real” change in income or an artifact of changes to survey questions.
The earnings questions were not changed in the redesign and the difference in earnings across the two subsamples was not statistically significant. Therefore it is appropriate to compare earnings over the entire length of the time series.
On the other hand, there were major changes to the questions concerning retirement income, interest income, dividends, disability income and public assistance. Estimates for these income sources should be compared with caution to pre-2013 estimates.
For poverty, our research found that for the total population and for most major demographic subgroups, the differences in poverty rates across the two subsamples were not statistically significant. Therefore, it is possible, with caution, to make comparisons to earlier years. For specific demographic groups for whom the differences were statistically significant, such as blacks and children, comparisons may not be appropriate.
To assist users in gaging the impact the questionnaire changes had on income and poverty estimates, the new report, Income and Poverty in the United States: 2014, will include an appendix showing estimates for 2013 by selected demographic characteristics for both the traditional and redesigned questions. In addition, the full set of detailed tables showing estimates for 2013 using the redesigned questions are available on-line. When making historical income and poverty comparisons, users should consult these tables.
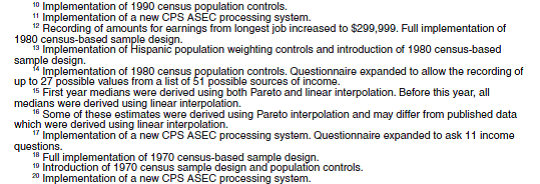
The Census Bureau is constantly researching new methods and working to improve its surveys and we have made methodological changes to the Current Population Survey in the past. We publish tables with income estimates back to 1947 and poverty estimates back to 1959 but include extensive footnotes with these tables noting many of these changes (see Figure 1). Data users should take into account all of these changes, including the 2014 redesign when making historical comparisons for income and poverty.
Figure 1 Examples of Footnotes Showing Historical ASEC Changes