An official website of the United States government
Here’s how you know
Official websites use .gov
A .gov website belongs to an official government organization in the United States.
Secure .gov websites use HTTPS
A lock (
) or https:// means you’ve safely connected to the .gov website. Share sensitive information only on official, secure websites.
-
//
- Census.gov /
- Census Blogs /
- Random Samplings /
- Census Bureau Releases 2014 Supplemental Poverty Measure
Census Bureau Releases 2014 Supplemental Poverty Measure
Census Bureau Releases 2014 Supplemental Poverty Measure
Today, the Census Bureau, with support from the Bureau of Labor Statistics, released its fifth annual report, The Supplemental Poverty Measure: 2014. This measure extends information provided by the official poverty measure by explicitly including benefits from many of the government programs designed to assist low-income families and individuals.
According to the report, the supplemental poverty measure rate was 15.3 percent last year, which was higher than the official measure of 14.9 percent for 2014. Both the supplemental measure rate and the official poverty rate were not significantly different from the corresponding rates in 2013.
There has been a continuing discussion about the best approach to measure income and poverty in the United States since the publication of the first official U.S. poverty estimates in 1964. In 2009, an interagency group asked the Census Bureau, in cooperation with the Bureau of Labor Statistics, to develop a supplemental measure to allow for an improved understanding of the economic well-being of American families and the way that federal policies affect those living in poverty.
The official measure only looks at pre-tax money income. Income for the supplemental measure adds the value of noncash benefits such as the Supplemental Nutrition Assistance Program, school lunches, housing assistance and refundable tax credits like the earned income tax credit. Additionally, supplemental poverty measure resources deduct from income necessary expenses for critical goods and services such as taxes, childcare and commuting expenses, and contributions toward the cost of medical care and health insurance premiums.
The important contribution that the supplemental poverty measure provides is allowing us to gauge the effectiveness of tax credits and transfers in reducing poverty. It can also show the effect of necessary expenses that families face such as paying taxes, or work-related, and medical out-of-pocket expenses on their ability to meet basic needs. For example, the SPM report shows that:
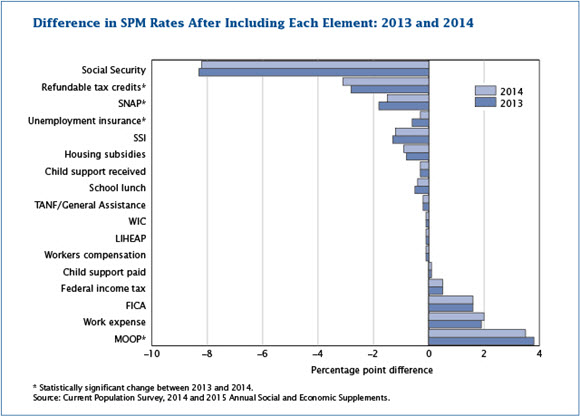
- Without Social Security benefits, the supplemental poverty rate overall would have been 8.2 percentage points higher (or 23.5 percent rather than 15.3 percent). This represented about 26 million individuals.
- People 65 and older had a supplemental poverty rate of 14.4 percent, equating to 6.6 million people. Excluding Social Security from income would result in a supplemental poverty measure rate of 50 percent.
- Not including refundable tax credits (the Earned Income Tax Credit and the refundable portion of the child tax credit) in resources, the poverty rate for all people would have been higher, 18.4 percent rather than 15.3 percent.
- For children, not accounting for refundable tax credits would have resulted in a poverty rate of 23.8 percent rather than 16.7 percent. This difference represents 5.2 million children.
- Taking account of other noncash benefits also lowered poverty rates, for example, Supplemental Nutrition Assistance Program benefits lowered the poverty rates by 1.5 percentage points or almost 5 million people.
- The figure shows the effect of various elements of the supplemental poverty measure on poverty rates for 2013 and 2014. Items with an asterisk had a statistically different effect on supplemental poverty measure rates between the two years.
- Compared to 2013, the Supplemental Nutrition Assistance Program and Unemployment Insurance lowered supplemental poverty measure rates less, while refundable tax credits had a larger effect, reducing poverty rates more, in 2014.
- Medical Out-of-Pocket Expenses had a smaller effect on supplemental poverty measure rates in 2014 than in the previous year, increasing the number of poor by 11 million compared to 12 million in 2013.
- The report shows changes in poverty rates for selected groups from 2013 to 2014. While for most groups there were no changes in supplemental poverty measure rates across the two years, there were declines for children, those 65 years of age and over, the native born, people in homes without mortgages, and those residing in the Midwest.
Share
 Yes
Yes
 No
NoComments or suggestions?


Top

