New Population Projections Account for Differences in Fertility of Native- and Foreign-Born Women
New Population Projections Account for Differences in Fertility of Native- and Foreign-Born Women
Last December, the U.S. Census Bureau released its latest series of national population projections, providing perspective on the future composition of the nation’s population. A new report released today explores these projections. It uses current data, along with past trends in fertility, mortality and international migration, to anticipate changes in the population in the years to come.
This series of projections is the first to distinguish between the fertility of native- and foreign-born women, which allows us to make separate assumptions about how the fertility of women in each of these groups will change over time. Incorporating different fertility rates for women based on their nativity, which are consistent with past and present trends in fertility, is intended to improve Census Bureau projections of both births and the population.
Researchers, policymakers, businesses and other government agencies use population projections and the components of change (births, deaths and net migration) for planning purposes. For example, projections of births are of potential interest to those associated with the child care industry, while projections of the population under age 18 can be used by those tasked with planning for future demands on the education system.
Here is a look at the fertility assumptions used to produce the projections:
The total fertility rate is a measure used by demographers to estimate the average number of children women would have by the end of their reproductive years, assuming that they bore children according to a given set of age-specific fertility rates (the number of births during a year to women in a particular age group).
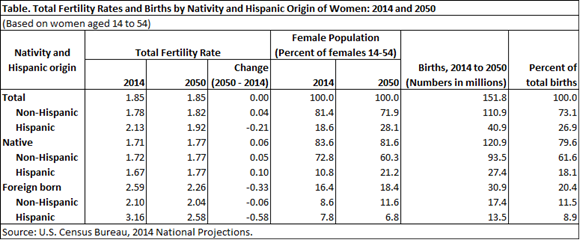
In 2014, the fertility rate in the projections was 1.85 for the total population, but this number masks considerable variation in the rates of foreign- and native-born women (see table). In the United States, foreign-born women have historically had higher fertility rates when compared with native-born women. This is reflected in the fertility assumptions used to produce the national projections. For instance, the fertility rate for foreign-born women in 2014 was 2.59 compared with 1.71 for native-born women.
There is also variation in fertility rates by Hispanic origin. In 2014, the fertility rate for all Hispanic women in the projections was 2.13 compared with 1.78 for all non-Hispanics. Of all women, foreign-born Hispanic women were projected to have the highest fertility rate throughout the projections series, at 3.16 in 2014 and 2.58 in 2050.
Projected births are calculated by applying these fertility rates to the projected female population. The share of projected births for any group reflects both the fertility rate for that group and the size of the population to which the rates are applied. Although fertility rates are higher for foreign-born women, the number of births projected to occur is lower than the number to native-born women.
Foreign-born women are projected to represent a smaller share of the total female population in the ages 14 to 54. In addition, foreign-born Hispanic women are projected to have the highest fertility rates. However, they are projected to contribute only 13.5 million, or just under 9 percent, of all births between 2014 and 2050. The relatively small share of births to women in this group is because they represented only 7.8 percent of the total female population in the reproductive ages in 2014 and 6.8 percent in 2050. Even though each woman in this group is projected to have more children on average, the collective number of children born to the group is small.
Learn more about how the U.S. population is projected to change by viewing the 2014 national population projections at:


