Moving - County-to-County
Moving - County-to-County
Over the course of a year, how many Americans move to a new county? About 6 percent of the population age 1 and older, according to American Community Survey data gathered from 2007 to 2011.
The latest version of the county-to-county migration products are now available, including the updated Census Flows Mapper. In 2011, there were 3,221 counties or county-equivalents (e.g., Louisiana parishes, Alaska boroughs, Virginia independent cities) in the U.S. That results in 10,371,620 (3,221 x 3,220) combinations of moves people could make between counties.
During the data collection period, almost 17 million people moved to a new county over the course of a year. However, not all counties saw moves between them. In fact, most did not. The survey captured migration between 262,196 county pairs, averaging 64 movers between counties. The largest flows were from Los Angeles County to San Bernardino County, Calif. (41,764) and from Los Angeles to Orange County, Calif. (40,794). (The estimates are not statistically different from each other.)
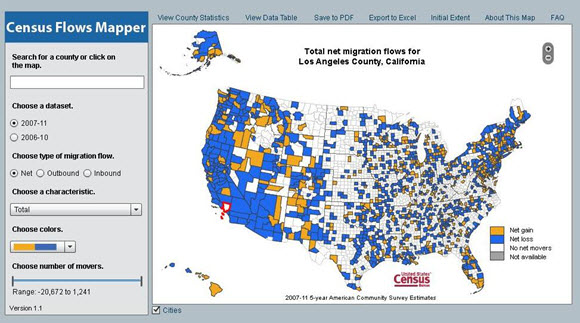
Our tool, the Census Flows Mapper, based on county-to-county flows, allows us not only to see where people are moving to and from, but also the net gain or loss for a county.
These migration products include the full county-to-county migration flow files, which are based on the current residence of respondents and the residence one year prior. The estimates represent the number of movers between counties in a 12-month interval over the five-year period, similar to annual migration patterns averaged over five years. Multiple years of American Community Survey data are used in order to get a more robust dataset.
Because the American Community Survey is a sample of the population, there is a potential variability in the estimates. We statistically measure this by using the coefficient of variation (CV), the ratio of the standard error of the estimate to the estimate itself – a measure of relative variability between estimates.
The table below shows the distribution of county pairs by the number of movers and their associated CVs. A CV of 0.61 or over means that there is a high potential of variability for those estimates. For the most part, the estimates with high potential variability or high CVs are smaller flows of 100 or fewer people and have less impact on migration trends for a given county, especially one with a larger overall population.
The inclusion of all flows, even the smaller ones with high CVs, allow users to collapse counties into larger areas (e.g., metropolitan areas, states, remainder of U.S.) and thus customize their own geographies or flows in addition to other potential research uses.
| Number of Movers | |||||
|---|---|---|---|---|---|
| CV | 1-100 | 101-500 | 501-1,000 | 1,001-10,000 | Over 10,000 |
| 0.00-0.10 | 7 | 1 | 0 | 196 | 66 |
| 0.11-0.20 | 6 | 146 | 503 | 1,095 | 0 |
| 0.21-0.30 | 139 | 2,495 | 1,228 | 260 | 0 |
| 0.31-0.60 | 20,356 | 15,139 | 583 | 14 | 0 |
| 0.61 and over | 212,714 | 7,944 | 24 | 0 | 0 |
Besides the basic county-to-county tables, the package also includes tables by selected characteristics (educational attainment, individual income and household income), Census Flows Mapper tool for visual representation of the flows, working paper with findings and a PowerPoint tutorial. Additional tables use minor civil divisions for selected states rather than counties. The minor civil divisions in those states provide a wide range of government services, and in the case of New England, are the primary government unit at the substate level.
Working Paper


