The Difference International Migration Makes in Projections of the U.S. Population
The Difference International Migration Makes in Projections of the U.S. Population
Recent Census Bureau projections highlighted that international migration will likely become the main driver of growth of our nation’s population between 2027 and 2038. This range was created from different projections series, which assumed low, middle, and high levels of international migration.
However, it is difficult to anticipate how many individuals will migrate into or out of the United States in the future. What would happen if there were no international migration in the future? What kind of impact would it have on our population?
We produce projections with different assumptions about international migration to help answer this question. Here we compare a series of projections where we assume there is no international migration in the future with the projections that assume there will be international migration.
Projections With versus Without International Migration
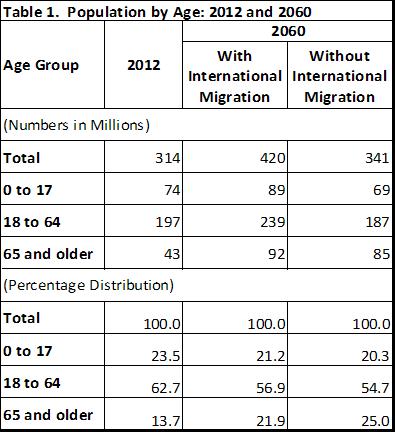
By 2060, our middle series projects the population to increase to 420 million with international migration, compared to just 341 without it.
Because immigrants tend to be younger adults, the impact is most noticeable for the population under 65 (see Table 1). With international migration, the size of the working-age population is projected to increase from 197 million in 2012 to 239 million in 2060. In contrast, in the series without international migration the number of working-age adults (18-64 years) is projected to decrease to 187 million by 2060.
The population under 18 years is projected to grow from 74 million in 2012 to 89 million in 2060 with international migration. Without international migration, the number of children is projected to decrease to 69 million by 2060.
The population 65 years and over is projected to more than double, from 43 million in 2012 to 92 million in 2060. Without international migration, the number of those 65 years and over would still nearly double, from 43 to 85 million.
Illustrating the Differences by Age
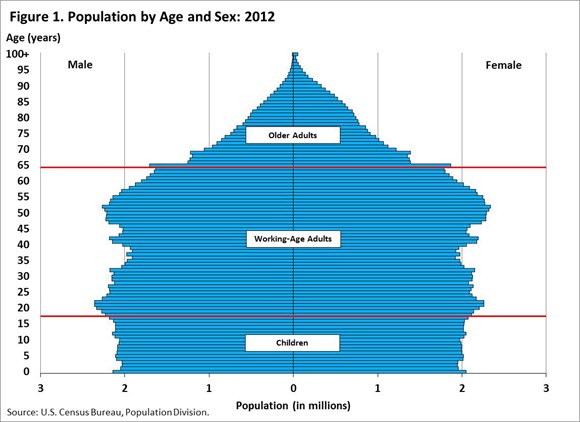
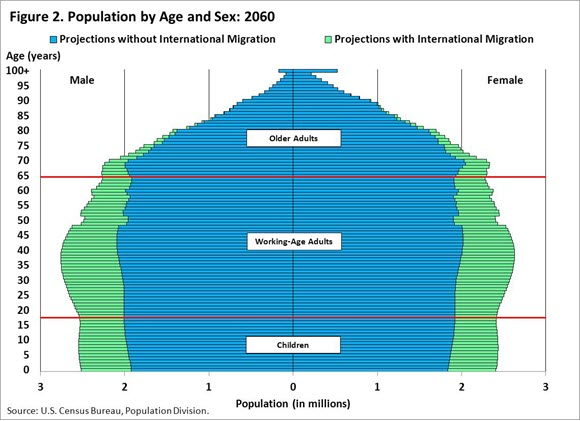
To illustrate the differences between the series with and without international migration, we show the projections of the U.S. population by age and sex in 2012 and 2060 in the figures below. Each bar represents the projected size of a particular age category. The red lines divide the figures into children (under 18 years), the working-age population (18 to 64 years), and the older population (65 years and older).
The figures show the projections with international migration (green) and without international migration (blue). Differences at each age between the series with and without international migration in 2060 represent the cumulative difference over the 48-year period of international migration as well as the effects of births to immigrants and the aging of the foreign-born population in the United States.
In 2012 (see Figure 1), we can see that most of the population is under the age of 65. By 2060 (see Figure 2), the share of the population in the oldest ages is projected to increase, which is shown by the increase in the size of the population at the top of the figure. The population in the older ages is projected to increase considerably over the coming decades in both series. Because immigrants tend to be younger adults, international migration makes little difference in the older ages.
If future levels of international migration differ from what was projected, the growth in children and the working-age population could be very different from what we currently project. Lower international migration results in slower or even negative growth in the size of the child and working-age populations. Higher international migration bolsters the size of these age groups.
Uses of the Population Projections
The Census Bureau’s population projections are used by researchers, policymakers, businesses, and other government agencies for a variety of purposes. A topic of great interest is the aging of the population. Projections of the old-age population are of particular interest for those assessing government programs such as Medicare and Social Security. Projections of the working-age population, typically between the ages of 18 and 64, are of interest to businesses and service providers attempting to evaluate future demand for their products and services as well as the means of supplying those goods. Projections of births and the population under the age of 18 are of interest to those tasked with planning for future demands on the education system.
For Further Information
If you find the discussion above interesting, more is available in our recent population projections release:


