Public Employment and Public Pensions: A 20-Year Comparison
Public Employment and Public Pensions: A 20-Year Comparison
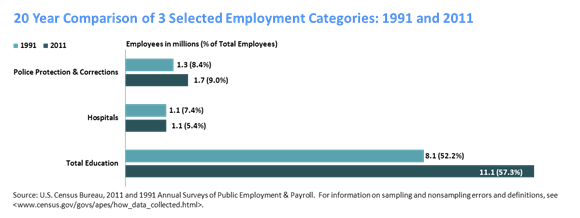
According to the 2011 Annual Survey of Public Employment and Payroll, there were 19.3 million state and local government employees, with 11.1 million, or 57.3 percent, working in education.
To understand the magnitude of employment in education, consider these two categories of public employment: police protection and corrections with 1.7 million employees and hospitals with 1.1 million employees (9.0 and 5.4 percent respectively, of all state and local government employment).
From 1991 to 2011, the total number of state and local government employees grew 24.9 percent from 15.5 million to 19.3 million. Contributing to the increase in the total number of employees was a 37.0 percent increase in the number of education employees and a 35.0 percent increase in the number of employees in police protection and corrections.
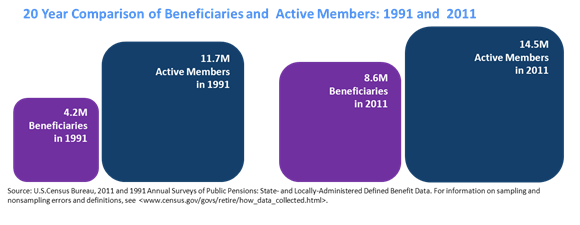
As the number of state and local government employees grew, the number of state and local government retirees also grew. Looking back 20 years, there were 4.2 million beneficiaries (retirees and survivors of deceased retirees) and 11.7 million active members (employees who pay into the pension systems) in 1991. According to the 2011 Annual Survey of Public Pensions, there were 8.6 million beneficiaries compared with 14.5 million active members, representing a 106.0 percent increase in beneficiaries but only a 24.2 percent increase in active members. Considering that 2011 was the year that the first baby boomers turned 65, one may expect the number of retirees to continue to grow.
For a look at more detailed statistics on public employment and payroll, see the 2011 Annual Survey of Public Employment and Payroll Summary Report [PDF <1.0 MB].
For more detailed information regarding the revenues, expenditures, investments, and membership information of state and local public pension systems, see the 2011 Annual Survey of Public Pensions: State- and Locally-Administered Defined Benefit Data Summary Report [PDF 1.2 MB].


