An official website of the United States government
Here’s how you know
Official websites use .gov
A .gov website belongs to an official government organization in the United States.
Secure .gov websites use HTTPS
A lock (
) or https:// means you’ve safely connected to the .gov website. Share sensitive information only on official, secure websites.
-
//
- Census.gov /
- Census Blogs /
- Random Samplings /
- What a Difference Four Years Make: U.S. Population Projected to Grow at a Slower Pace Over the Next Five Decades
What a Difference Four Years Make: U.S. Population Projected to Grow at a Slower Pace Over the Next Five Decades
What a Difference Four Years Make: U.S. Population Projected to Grow at a Slower Pace Over the Next Five Decades
The U.S. population is projected to grow at a slower pace over the coming years than was projected four years ago, according to new population projections released today. So, how much is the U.S. population expected to grow over the next several decades? Moreover, how and why has the projected growth rate of the population changed between the 2008 and 2012 series?
What difference does four years make? The population projections are based on assumptions about the future levels of fertility, mortality, and international migration that are based on past trends. The new series of projections incorporates data that are more recent on births, deaths, and net international migration. Fertility and international migration have declined in recent years. The annual number of births in the United States has been declining since 2008, while the number of net international migrants began to decline after 2001. Growth of the population is contingent on births, deaths, and migration. Declines in births and migration reduce the population’s growth rate, while decreases in deaths increase population size.
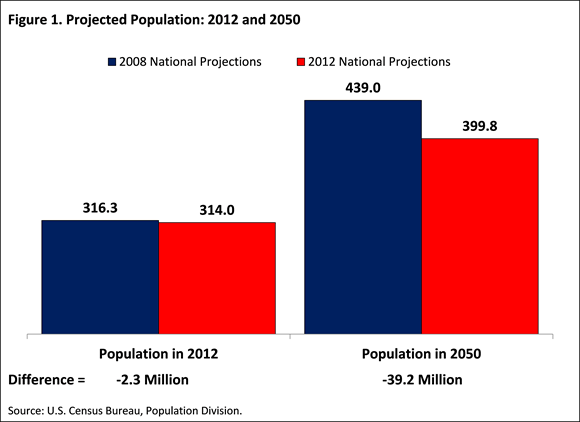
According to the 2012 National Projections, the U.S. population is projected to be around 399.8 million in 2050. In the 2008 series, the population was projected to be around 439.0 million. The new series projects 39.2 million fewer people living in the United States in 2050 than the 2008 series (Figure 1).
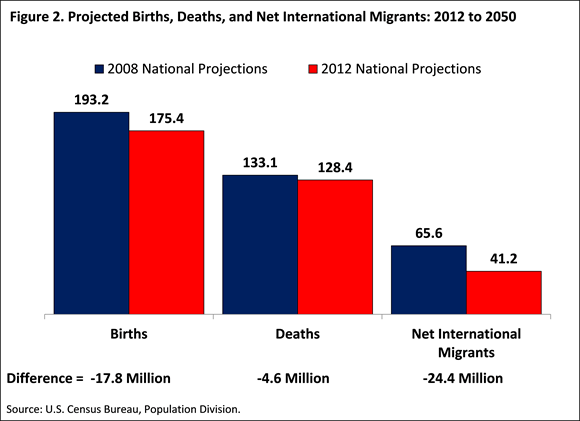
What is driving this difference? The most important driver is international migration (Figure 2). The 2012 series projects 41.2 million net number of international migrants, while the series released in 2008 projected 65.6 million net migrants – a difference of 24.4 million. The next largest driver of this difference is the projection of births. The 2008 series projected 193.2 million births to occur between 2012 and 2050. The 2012 series projects fewer births, just over 175 million for the 38-year period. The total number of projected deaths was also lower in the 2012 series, which projected 128.4 million compared to the 133.1 million deaths projected in the 2008 series (a difference of 4.6 million). Finally, the 2012 National Projections are based on a smaller population in 2011 than what was projected in the 2008 series. In 2011, the Census Bureau estimated there were 311.6 million people living in the United States. This estimate is 1.6 million lower than the projected population in 2011 from the 2008 National Projections.
When we add up the numbers, 24.4 million fewer migrants plus 17.8 million fewer births minus 4.6 million fewer deaths plus 1.6 million difference in the estimates of the population for the population in 2011, we arrive at the total difference of 39.2 million.
Share
 Yes
Yes
 No
NoComments or suggestions?


Top


