An official website of the United States government
Here’s how you know
Official websites use .gov
A .gov website belongs to an official government organization in the United States.
Secure .gov websites use HTTPS
A lock (
) or https:// means you’ve safely connected to the .gov website. Share sensitive information only on official, secure websites.
-
//
- Census.gov /
- Census Blogs /
- Random Samplings /
- How We Measure Poverty and Income
How We Measure Poverty and Income
How We Measure Poverty and Income
The Current Population Survey serves as the nation’s primary source of statistics on labor force characteristics. A supplement to the survey provides the official annual statistics on the nation’s income and poverty levels as well as statistics on age, sex, race, marital status, educational attainment, employee benefits, work schedules, school enrollment, health insurance, noncash benefits and migration.
The American Community Survey, on the other hand, is the only source of small-area estimates available on a wide range of important social and economic characteristics for all communities in the country. In addition to income, poverty and health insurance, these topics include education, language ability, the foreign-born, marital status, migration, homeownership, the cost and value of our homes and many more.
Second, the reference periods for the two surveys are very different. The CPS asks respondents to report on their income in the previous calendar year. The ACS asks about income in the prior 12 months. Since the ACS is a continuous survey administered throughout the year, some respondents to the 2011 ACS (those who fill out the survey in January) are reporting income received between January 2010 and December 2010 while other respondents (those who fill out the survey in December) are reporting income received between December 2010 and November 2011.
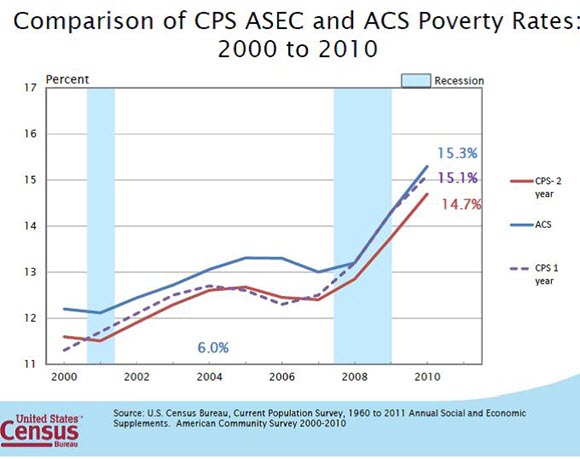
These differences often result in different national estimates for such key indicators as poverty, median income and inequality. Despite these differences in the “levels” of these indicators, the trends over time tend to be very similar across the two surveys. The following graph shows poverty rates from the ACS compared with poverty rates from the CPS for previous years. The red line adjusts for the differences in reference periods.
Many people contact us each year asking how to know which estimate to use for a particular purpose. For national estimates, we recommend the CPS because it provides a consistent historical time series at the national level and can also be used to look at limited state-level trends. However, because of the larger sample size and smaller sampling errors we recommend using the ACS for subnational geographies.
Share
 Yes
Yes
 No
NoComments or suggestions?


Top

