The Evolving Picture of our Governments
The Evolving Picture of our Governments
Governments. What word comes to mind when you think of governments? Perhaps a state capital building, Congress, or a courthouse is what you think of first. How about the tens of thousands of governments that provide the day-to-day services we all use? These are the governments that we all depend on but we so quickly forget to think of – they are a natural part of our lives. Our cities and towns are governments. Our public schools are governments. Special districts – like your neighborhood fire department and your library – are governments.
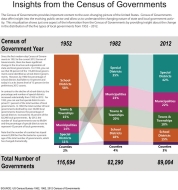
Today, we released the first results from the 2012 Census of Governments – preliminary statistics on the number and types of governments. These statistics help us see the many forms of governments and better see where our services come from. Just like our nation’s demographics, our governments change over time. Governments grow and shrink depending on the needs of the times. While states, counties, cities, and towns remain fairly unchanged in total numbers over recent times, special districts and independent school districts have demonstrated marked change. The closer we get to more localized services – school districts and special districts – the more likely we are to see governments coming into existence and merging or consolidating as the service needs change.
Preliminary counts released today show us that as a nation we have nearly 90,000 state and local governments. Of those, nearly 40,000 are our states, counties, cities, and towns (general purpose governments). The rest are what we call special purpose governments – special districts and independent school districts. Historically, special purpose governments have demonstrated the most change. We’re familiar with the rise and fall of the one-room schoolhouse – this consolidation of public school districts has resulted in a dramatic decline of school districts from a high of 67,346 in 1952 to today’s count of 12,884. Unlike the decline in school districts, special districts have grown with a 2012 special districts count (37, 203) that is just over three times the number of districts in 1952. Special districts are developed by law to provide one (or a limited number) of specific services. For example, a special district – like a community development district – may be developed to accommodate the growing needs of a new community. These types of districts are known to change over time as the needs of the area change and laws permit. Take a look at the visualizations and data tables released today to better see how our governments have changed. Watch the evolution of our public school systems and watch how special districts have changed to accommodate the needs of our communities.
Every five years since 1952, the Census Bureau has completed a comprehensive count of all state and local governments in the country. The preliminary information released today represents the first in the series of statistics from the 2012 Census of Governments.
For more details, see the:


