2010 Census Statistics Showed Asians Were Fastest-Growing Race Group
2010 Census Statistics Showed Asians Were Fastest-Growing Race Group
According to the 2010 Census, the Asian population grew faster than any other race group in the United States between 2000 and 2010. This was observed for the population who reported Asian alone (increased 43 percent), as well as for the population who reported Asian alone or in combination with another race (increased 46 percent). The Asian alone-or-in-combination population grew by at least 30 percent in all states except for Hawaii, which had an 11 percent increase. The top five states that experienced the fastest growth were Nevada with 116 percent, Arizona with 95 percent, North Carolina with 85 percent, North Dakota with 85 percent, and Georgia with 83 percent. These same five states also experienced the most rapid growth in the Asian alone population.
The Asian Indian population was the largest detailed Asian group in nearly half of all states.
Chinese, Filipino, Asian Indian, Vietnamese, Korean and Japanese each had populations of 1 million or more, and the Chinese population was the largest detailed Asian group. However, there is not one particular detailed Asian group that is the largest across the entire country. Instead, we see the Asian population is diverse, with different detailed Asian groups being predominant in different states.
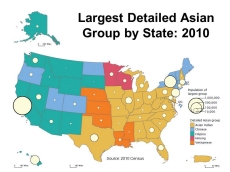
The figure shown presents a state-level map illustrating the diversity of the largest detailed Asian alone-or-in-any-combination population groups across the country. There are two dimensions to the map shown. First, the different colors denote which detailed Asian group was the largest in each state, based on the alone-or-in-any combination population. The legend shows that there were 5 different detailed Asian groups represented as the largest in at least one state – Asian Indian, Chinese, Filipino, Vietnamese, and Hmong. Note that Hmong was the only detailed Asian group shown in this map that does not have a national alone-or-in-any-combination population of 1 million or more, and that Japanese and Korean – which have populations over 1 million – were not the largest group in any state.
Second, the map uses circles to illustrate the size of that group. The legend presents example symbol sizes from the many symbols shown on the map. So, for example, in California, the green color shows that Filipinos were the largest detailed Asian population, and the size of the circle indicates that the Filipino population was over 1 million in California.
The Asian Indian population was the largest detailed Asian group in 23 states, more than any other detailed Asian group. Of these states, 13 were in the South (Alabama, Arkansas, Delaware, Florida, Georgia, Kentucky, Maryland, North Carolina, South Carolina, Tennessee, Texas, Virginia, and West Virginia); 6 were in the Midwest (Illinois, Indiana, Iowa, Michigan, Missouri, and Ohio); and 4 were in the Northeast (Connecticut, Pennsylvania, New Hampshire, and New Jersey). The Asian Indian population was not the largest detailed Asian group in any state in the West.
For every state in the West, either the Filipino population or the Chinese population was the largest detailed Asian group. Filipino was the largest detailed Asian group in Alaska, Arizona, California, Hawaii, Idaho, Montana, Nevada, New Mexico, Washington, and Wyoming, while Chinese was the largest in Colorado, Oregon, and Utah. Outside of the West, Filipino was the largest detailed Asian group in South Dakota, while Chinese was the largest in the District of Columbia and North Dakota, as well as five states in the Northeast (Maine, Massachusetts, New York, Rhode Island, and Vermont).
The Vietnamese population was the largest detailed Asian group in five states – Louisiana, Mississippi, and Oklahoma in the South; and Kansas and Nebraska in the Midwest. The Hmong population was the largest detailed Asian group in two states (Minnesota and Wisconsin), both in the midwest.
For more information on the Asian population, see the 2010 Census Brief, The Asian Population: 2010.


