American Community Survey Takes Our Nation’s Demographic Pulse Each Year
American Community Survey Takes Our Nation’s Demographic Pulse Each Year
In every census between 1940 and 2000, millions of American households received a “long form”, which contained scores of questions on a wide range of demographic, socioeconomic and housing topics.
Following the 2000 Census, the long form was, in effect, split off from the census and turned into the American Community Survey. The rationale was simple: because our nation changes so rapidly, our communities needed this kind of information on a much more frequent basis − annually, rather than once a decade − in order to make informed decisions about where to build roads, construct schools and locate emergency services. And businesses sought these key data much more often than once every 10 years too for the purposes of site selection and marketing.
Yesterday, the Census Bureau released results from the annual ACS, which cover 2010. The information was collected from almost 2 million housing unit interviews across the country.
The survey offers statistics on more than 40 subjects, such as income, health insurance coverage, commuting to work, educational attainment, language spoken at home, ancestry, selected monthly homeowner costs, the foreign-born population, occupation, and military veterans. The numbers are available for not only the nation as a whole and all of our states and congressional districts, but also for counties and cities with total populations of more than 65,000. Statistics for smaller areas will be available later in the year.
Dig deep into this goldmine of numbers and here are a few of the nuggets you will find:
- Average travel time to work was highest for Maryland (31.8 minutes) and then New York (31.3 minutes). North Dakota had the lowest average travel times (16.1) followed by South Dakota (16.8).
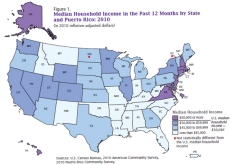
- Real median household income decreased between the 2009 ACS and 2010 ACS in 35 states. For 15 states and the District of Columbia, real median household income in the 2010 ACS was not statistically different from that in the 2009 ACS.
- In 2010, 32 percent of the foreign-born population from Latin America were naturalized citizens. Among counties of birth, Jamaica (61 percent) and Cuba (56 percent) had the highest percent naturalized. Mexico (23 percent) and Honduras (21 percent) were among the countries with the lowest percent naturalized.
- In 2010, the percent of individuals 25 and older with at least a bachelor’s degree ranged from 17.5 percent in West Virginia to 39.0 percent in Massachusetts. In six states more than one-third of those 25 and over had a bachelor’s degree: Colorado, Connecticut, Maryland, Massachusetts, New Jersey, and Virginia.
- In October, the Census Bureau will release a set of ACS estimates covering all areas with populations of 20,000 or more, based on data collected between 2008 and 2010. A third set of ACS estimates, covering the 2006-2010 period, will be released in December, providing information for all geographic areas regardless of size.Nowhere else will one see data on such a wide array of key attributes about our communities. To dig into the data yourself, visit the American FactFinder.


