Mapping the 2010 Census
Mapping the 2010 Census

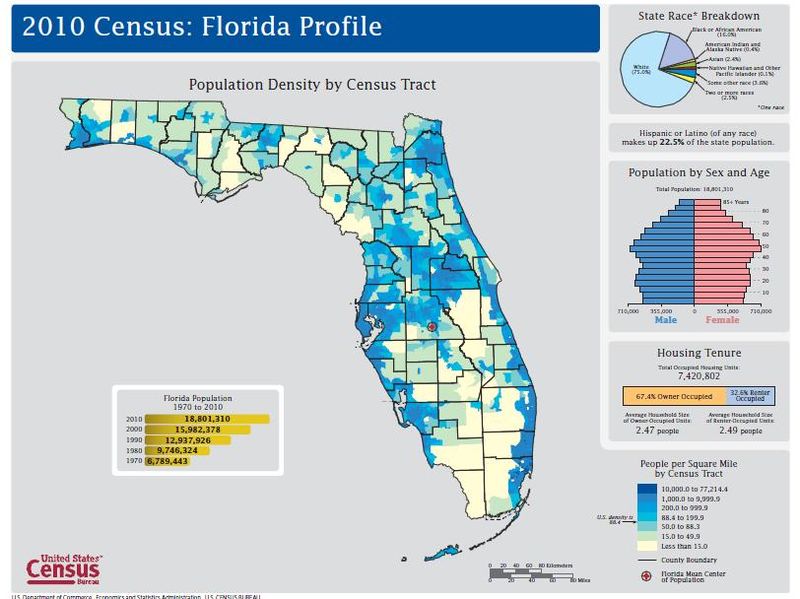
The Census Bureau recently released a series of new maps illustrating 2010 Census data for each state. The 2010 Census Profile maps showcase population and housing data for each state in the United States, the District of Columbia, and Puerto Rico. A national map will also be available.
In addition to a population density map, each includes a pie chart showing percent of total population by race, a population pyramid, and a bar chart illustrating housing occupancy rates.
The maps are being released on a flow basis, with more than 25 available now. To find out more information about your state, click here .
Page Last Revised - December 16, 2021