Population Distribution and Change: 2000 to 2010
Population Distribution and Change: 2000 to 2010
The 2010 Census reported 308.7 million people in the United States, a 9.7 percent increase from the Census 2000 population of 281.4 million.
The increase of 9.7 percent over the last decade was lower than the 13.2 percent increase for the 1990s and comparable to the growth during the 1980s of 9.8 percent. Since 1900, only the 1930s experienced lower growth (7.3 percent) than this past decade.
From 2000 to 2010, regional growth was much faster for the South and West (14.3 and 13.8 percent, respectively) than for the Midwest (3.9) and Northeast (3.2). Overall, the South and West accounted for 84.4 percent of the U.S. population increase from 2000 to 2010.
Nevada was the fastest-growing state between 2000 and 2010, growing by 35.1 percent; followed by Arizona (24.6), Utah (23.8), Idaho (21.1), and Texas (20.6). Rhode Island, Louisiana, and Ohio were the slowest-increasing states, all of which grew by less than 2.0 percent. Unlike the 1990s in which every state grew, one state (Michigan) declined over this decade, losing 0.6 percent of its population.
Nevada is the only state that has maintained a growth rate of 25.0 percent or greater for the last three decades; it has been the fastest-growing state for five straight decades. The District of Columbia experienced its first decennial population increase since the 1940s, increasing by 5.2 percent to surpass 600,000 people.
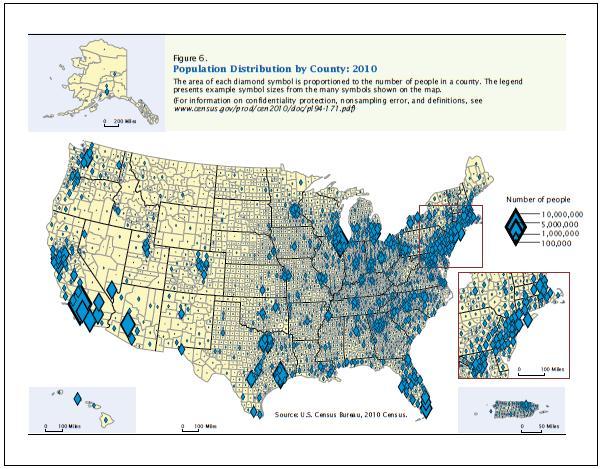
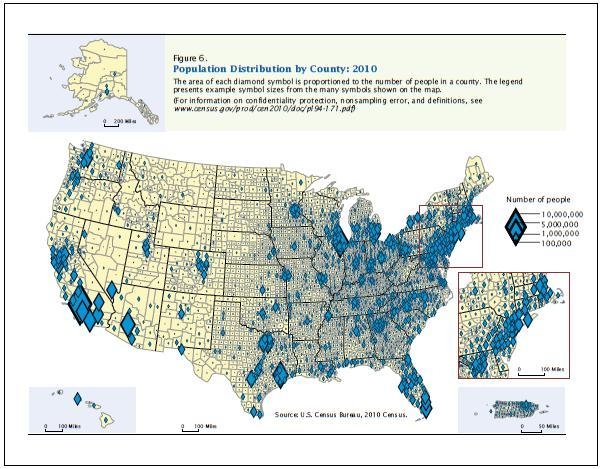
The ten most populous states contained 54.0 percent of the U.S. population in 2010, with one-fourth (26.5 percent) of the U.S. population in the three largest states: California, Texas, and New York. The next seven most populous states—Florida, Illinois, Pennsylvania, Ohio, Michigan, Georgia, and North Carolina—contained an additional 27.5 percent of the population. Nine of the ten largest states in 2000 were also among the ten largest in 2010. North Carolina, which was the eleventh largest state in 2000, moved into the top ten for 2010 (tenth largest)—replacing New Jersey, which fell from ninth largest in 2000 to eleventh in 2010.
The South contained the greatest number (four) of the ten largest states, with three others in the Midwest, two in the Northeast, and one in the West. Furthermore, the Northeast contained four of the ten least populous states (Maine, New Hampshire, Rhode Island, and Vermont), with three others in the West (Alaska, Montana, and Wyoming), two in the Midwest (North Dakota and South Dakota), and one in the South (Delaware).
Information on other population and housing topics is presented in the 2010 Census Briefs series, located on the U.S. Census Bureau’s website. This series also presents information about race, Hispanic origin, age, sex, household type, housing tenure, and people who reside in group quarters.
For more information on historical census data, click here.
Paul Mackun, Geographer, Population Division and Steven Wilson, Statistician, Population Division


