The Goods and Services Deficit Decreased to $51.1 billion in January 2019
The Goods and Services Deficit Decreased to $51.1 billion in January 2019
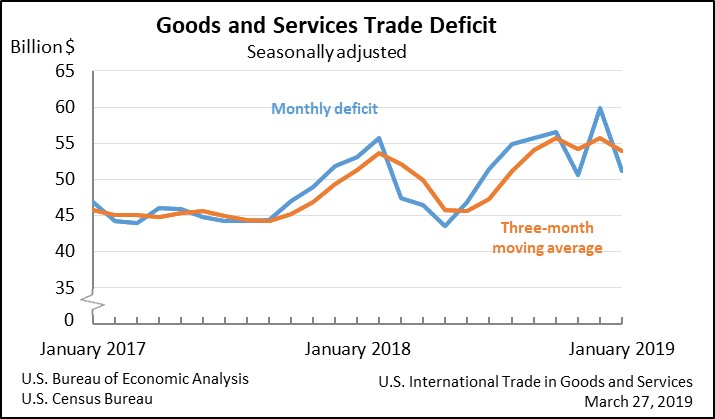
The U.S. Census Bureau and the U.S. Bureau of Economic Analysis announced today that the goods and services deficit was $51.1 billion in January, down $8.8 billion from $59.9 billion in December, revised.
January exports were $207.3 billion, $1.9 billion more than December exports. January imports were $258.5 billion, $6.8 billion less than December imports.
The January decrease in the goods and services deficit reflected a decrease in the goods deficit of $8.2 billion to $73.3 billion and an increase in the services surplus of $0.5 billion to $22.1 billion.
Year-over-year, the goods and services deficit decreased $1.9 billion, or 3.7 percent, from January 2018. Exports increased $6.1 billion or 3.0 percent. Imports increased $4.1 billion or 1.6 percent.
Exports (Exhibits 3, 6, and 7)
Exports of goods increased $1.8 billion to $137.4 billion in January.
Exports of goods on a Census basis increased $1.8 billion.
- Foods, feeds, and beverages increased $1.3 billion.
- Soybeans increased $0.9 billion.
- Automotive vehicles, parts, and engines increased $1.2 billion.
- Passenger cars increased $0.7 billion.
- Capital goods decreased $0.8 billion.
- Civilian aircraft decreased $1.3 billion.
Exports of services increased $0.2 billion to $70.0 billion in January.
- Other business services, which includes research and development services; professional and management services; and technical, trade-related, and other services, increased $0.1 billion.
- Transport increased $0.1 billion.
Imports (Exhibits 4, 6, and 8)
Imports of goods decreased $6.5 billion to $210.7 billion in January.
Imports of goods on a Census basis decreased $6.5 billion.
- Capital goods decreased $3.0 billion.
- Computer accessories decreased $0.9 billion.
- Semiconductors decreased $0.7 billion.
- Civilian aircraft decreased $0.7 billion.
- Industrial supplies and materials decreased $2.3 billion.
- Crude oil decreased $1.4 billion.
Imports of services decreased $0.3 billion to $47.8 billion in January.
- Transport decreased $0.2 billion.
- Travel (for all purposes including education) decreased $0.2 billion.
- Other business services increased $0.1 billion.
Goods by Selected Countries and Areas: Census Basis (Exhibit 19)
The January figures show surpluses, in billions of dollars, with South and Central America ($4.5), United Kingdom ($2.0), Hong Kong ($1.8), Canada ($1.4), and Brazil ($1.1). Deficits were recorded, in billions of dollars, with China ($33.2), European Union ($13.1), Mexico ($7.2), Germany ($6.0), Japan ($5.3), Italy ($2.9), South Korea ($2.4), Taiwan ($2.2), India ($1.9), France ($1.2), OPEC ($0.2), Saudi Arabia ($0.1), and Singapore (less than $0.1).
- The deficit with China decreased $5.5 billion to $33.2 billion in January. Exports decreased $0.2 billion to $7.5 billion and imports decreased $5.7 billion to $40.8 billion.
- The balance with Canada shifted from a deficit of $0.7 billion to a surplus of $1.4 billion in January. Exports increased $0.4 billion to $24.4 billion and imports decreased $1.6 billion to $23.0 billion.
- The deficit with South Korea increased $0.7 billion to $2.4 billion in January. Exports decreased $1.1 billion to $4.2 billion and imports decreased $0.4 billion to $6.6 billion.