The Goods and Services Deficit Increased to $59.8 billion in December 2018
The Goods and Services Deficit Increased to $59.8 billion in December 2018
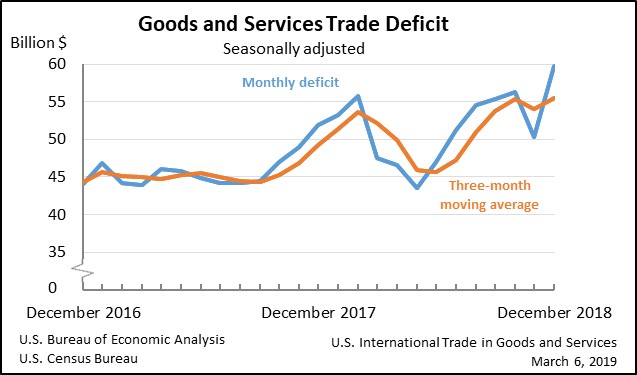
The U.S. Census Bureau and the U.S. Bureau of Economic Analysis announced today that the goods and services deficit was $59.8 billion in December, up $9.5 billion from $50.3 billion in November, revised.
Exports, Imports, and Balance (Exhibit 1)
December exports were $205.1 billion, $3.9 billion less than November exports. December imports were $264.9 billion, $5.5 billion more than November imports.
The December increase in the goods and services deficit reflected an increase in the goods deficit of $9.0 billion to $81.5 billion and a decrease in the services surplus of $0.5 billion to $21.8 billion.
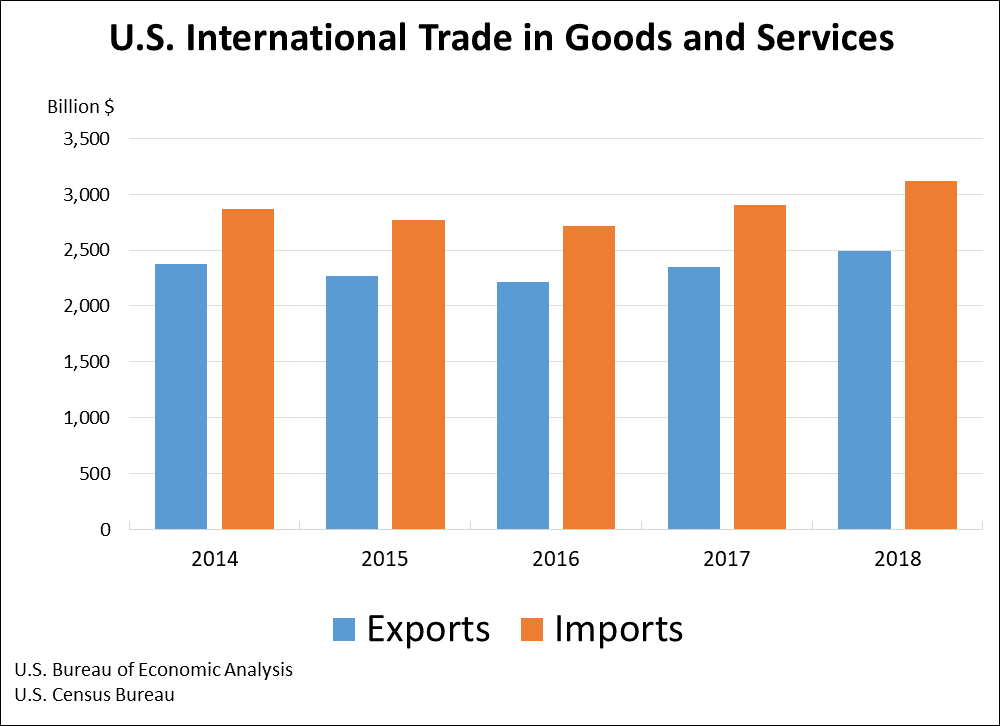
For 2018, the goods and services deficit increased $68.8 billion, or 12.5 percent, from 2017. Exports increased $148.9 billion or 6.3 percent. Imports increased $217.7 billion or 7.5 percent.
Annual Summary for 2018
or 2018, the goods and services deficit was $621.0 billion, up $68.8 billion from $552.3 billion in 2017. Exports were $2,500.0 billion in 2018, up $148.9 billion from 2017. Imports were $3,121.0 billion, up $217.7 billion from 2017.
The 2018 increase in the goods and services deficit reflected an increase in the goods deficit of $83.8 billion, or 10.4 percent, to $891.3 billion and an increase in the services surplus of $15.0 billion, or 5.9 percent, to $270.2 billion.
As a percentage of U.S. gross domestic product, the goods and services deficit was 3.0 percent in 2018, up from 2.8 percent in 2017.
Exports (Exhibits 3, 6, and 7)
Exports of goods increased $118.5 billion to $1,671.8 billion in 2018.
Exports of goods on a Census basis increased $117.8 billion.
- Industrial supplies and materials increased $74.2 billion.
- Crude oil increased $24.6 billion.
- Other petroleum products increased $14.4 billion.
- Capital goods increased $28.7 billion.
- Civilian aircraft engines increased $7.9 billion.
- Other industrial machines increased $2.9 billion.
- Computer accessories increased $2.5 billion.
Exports of services increased $30.4 billion to $828.1 billion in 2018.
- Other business services, which includes research and development services; professional and management services; and technical, trade-related, and other services, increased $8.5 billion.
- Financial services increased $4.6 billion.
Imports (Exhibits 4, 6, and 8)
Imports of goods increased $202.2 billion to $2,563.1 billion in 2018.
Imports of goods on a Census basis increased $200.8 billion.
- Industrial supplies and materials increased $68.4 billion.
- Crude oil increased $24.6 billion.
- Capital goods increased $52.7 billion.
- Computers increased $8.7 billion.
- Electric apparatus increased $5.4 billion.
- Computer accessories increased $5.4 billion.
- Other industrial machines increased $5.1 billion.
- Consumer goods increased $46.1 billion.
- Pharmaceutical preparations increased $23.7 billion.
Imports of services increased $15.4 billion to $557.9 billion in 2018.
- Travel (for all purposes including education) increased $10.1 billion.
- Other business services increased $7.0 billion.
- Transport increased $6.5 billion.
- Insurance services decreased $13.0 billion.
Goods by Selected Countries and Areas - Census Basis (14 and 14a)
The 2018 figures show surpluses, in billions of dollars, with South and Central America ($41.5), Hong Kong ($31.1), Netherlands ($24.8), Australia ($15.2), and Belgium ($14.2). Deficits were recorded, in billions of dollars, with China ($419.2), European Union ($169.3), Mexico ($81.5), Germany ($68.3), Japan ($67.6), Ireland ($46.8), Italy ($31.6), Malaysia ($26.5), India ($21.3), OPEC ($21.2), Canada ($19.8), Thailand ($19.3), Switzerland ($18.9), South Korea ($17.9), France ($16.2), Taiwan ($15.5), Russia ($14.1), Indonesia ($12.6), and Saudi Arabia ($10.5).
- The deficit with China increased $43.6 billion to $419.2 billion in 2018. Exports decreased $9.6 billion to $120.3 billion and imports increased $34.0 billion to $539.5 billion.
- The deficit with the European Union increased $17.9 billion to $169.3 billion in 2018. Exports increased $35.4 billion to $318.6 billion and imports increased $53.3 billion to $487.9 billion.
- The surplus with South and Central America increased $7.3 billion to $41.5 billion in 2018. Exports increased $13.6 billion to $163.8 billion and imports increased $6.3 billion to $122.3 billion.