
Official websites use .gov
A .gov website belongs to an official government organization in the United States.
Secure .gov websites use HTTPS
A lock (
) or https:// means you’ve safely connected to the .gov website. Share sensitive information only on official, secure websites.

Topics
Data & Maps
Surveys & Programs
Resource Library
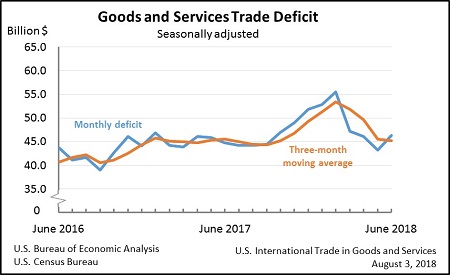
The Goods and Services Deficit increased to $46.3 billion in June 2018
The Goods and Services Deficit increased to $46.3 billion in June 2018
The U.S. Census Bureau and the U.S. Bureau of Economic Analysis announced today that the goods and services deficit was $46.3 billion in June, up $3.2 billion from $43.2 billion in May, revised.
Exports, Imports, and Balance (Exhibit 1)
June exports were $213.8 billion, $1.5 billion less than May exports. June imports were $260.2 billion, $1.6 billion more than May imports.
The June increase in the goods and services deficit reflected an increase in the goods deficit of $3.1 billion to $68.8 billion and a decrease in the services surplus of less than $0.1 billion to $22.5 billion.
Year-to-date, the goods and services deficit increased $19.6 billion, or 7.2 percent, from the same period in 2017. Exports increased $103.6 billion or 9.0 percent. Imports increased $123.2 billion or 8.6 percent.
Exports (Exhibits 3, 6, and 7)
Exports of goods decreased $1.7 billion to $143.2 billion in June.
Exports of goods on a Census basis decreased $1.7 billion.
- Consumer goods decreased $1.4 billion.
- Pharmaceutical preparations decreased $0.6 billion.
- Jewelry decreased $0.4 billion.
- Capital goods decreased $0.9 billion.
- Civilian aircraft engines decreased $0.4 billion.
- Civilian aircraft decreased $0.2 billion.
- Automotive vehicles, parts, and engines decreased $0.7 billion.
- Passenger cars decreased $0.9 billion.
- Industrial supplies and materials increased $2.0 billion.
- Other petroleum products increased $0.5 billion.
- Nonmonetary gold increased $0.5 billion.
- Fuel oil increased $0.5 billion.
Exports of services increased $0.2 billion to $70.6 billion in June.
- Financial services increased $0.1 billion.
Imports (Exhibits 4, 6, and 8)
Imports of goods increased $1.4 billion to $212.0 billion in June.
Imports of goods on a Census basis increased $1.5 billion.
- Consumer goods increased $2.0 billion.
- Pharmaceutical preparations increased $1.5 billion.
- Industrial supplies and materials increased $0.9 billion.
- Crude oil increased $1.2 billion.
- Capital goods decreased $1.5 billion.
- Computers decreased $0.8 billion.
- Telecommunications equipment decreased $0.5 billion.
Imports of services increased $0.2 billion to $48.1 billion in June.
- Charges for the use of intellectual property increased $0.3 billion. The increase reflects payments for the rights to broadcast the portion of the 2018 soccer World Cup that occurred in June.
Goods by Selected Countries and Areas: Monthly – Census Basis (Exhibit 19)
The June figures show surpluses, in billions of dollars, with South and Central America ($3.3), Hong Kong ($2.5), Brazil ($0.8), United Kingdom ($0.4), and Singapore (less than $0.1). Deficits were recorded, in billions of dollars, with China ($32.5), European Union ($12.8), Mexico ($6.7), Germany ($5.7), Japan ($5.6), Canada ($2.6), Italy ($2.2), OPEC ($1.8), India ($1.7), Taiwan ($1.4), South Korea ($1.3), Saudi Arabia ($0.8), and France ($0.7).
- The deficit with members of OPEC increased $1.6 billion to $1.8 billion in June. Exports decreased $0.8 billion to $5.0 billion and imports increased $0.7 billion to $6.7 billion.
- The deficit with the European Union increased $0.9 billion to $12.8 billion in June. Exports decreased $0.3 billion to $27.2 billion and imports increased $0.6 billion to $40.0 billion.
- The deficit with Japan decreased $0.4 billion to $5.6 billion in June. Exports decreased $0.2 billion to $6.1 billion and imports decreased $0.7 billion to $11.7 billion.
Page Last Revised - August 30, 2023
✕
Is this page helpful?
 Yes
Yes
 No
No
 Yes
Yes
 No
No✕
NO THANKS
255 characters maximum
 255 characters maximum reached
✕
Thank you for your feedback.
Comments or suggestions?

Comments or suggestions?