
Official websites use .gov
A .gov website belongs to an official government organization in the United States.
Secure .gov websites use HTTPS
A lock (
) or https:// means you’ve safely connected to the .gov website. Share sensitive information only on official, secure websites.

Topics
Data & Maps
Surveys & Programs
Resource Library
The Goods and Services Deficit Decreased to $46.2 billion in April 2018
The Goods and Services Deficit Decreased to $46.2 billion in April 2018
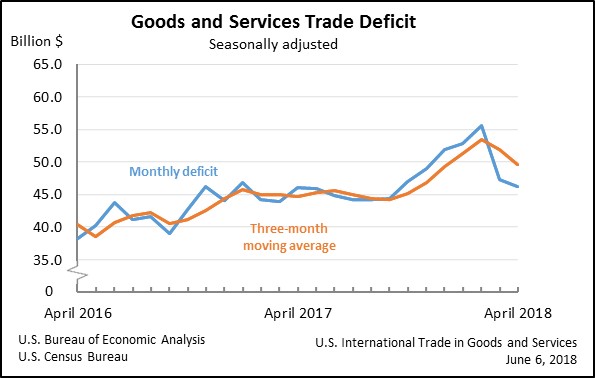
The U.S. Census Bureau and the U.S. Bureau of Economic Analysis announced today that the goods and services deficit was $46.2 billion in April, down $1.0 billion from $47.2 billion in March, revised.
Exports, Imports, and Balance (Exhibit 1)
April exports were $211.2 billion, $0.6 billion more than March exports. April imports were $257.4 billion, $0.4 billion less than March imports.
The April decrease in the goods and services deficit reflected a decrease in the goods deficit of $1.0 billion to $68.3 billion and a decrease in the services surplus of less than $0.1 billion to $22.1 billion.
Year-to-date, the goods and services deficit increased $20.8 billion, or 11.5 percent, from the same period in 2017. Exports increased $62.0 billion or 8.1 percent. Imports increased $82.8 billion or 8.7 percent.
Exports (Exhibits 3, 6, and 7)
Exports of goods increased $0.3 billion to $141.2 billion in April.
Exports of goods on a Census basis increased $0.3 billion.
- Industrial supplies and materials increased $1.3 billion.
- Fuel oil increased $0.5 billion.
- Other petroleum products increased $0.2 billion.
- Foods, feeds, and beverages increased $0.7 billion.
- Soybeans increased $0.3 billion.
- Corn increased $0.3 billion.
- Capital goods decreased $1.4 billion.
- Civilian aircraft decreased $2.8 billion.
Exports of services increased $0.3 billion to $70.0 billion in April.
- Other business services, which includes research and development services; professional and management services; and technical, trade-related, and other services, increased $0.1 billion.
- Financial services increased $0.1 billion.
- Charges for the use of intellectual property increased $0.1 billion.
Imports (Exhibit 4, 6, and 8)
Imports of goods decreased $0.7 billion to $209.5 billion in April.
Imports of goods on a Census basis decreased $0.9 billion.
- Consumer goods decreased $2.8 billion.
- Cell phones and other household goods decreased $2.2 billion.
- Automotive vehicles, parts, and engines decreased $0.9 billion.
- Passenger cars, new and used decreased $1.0 billion.
- Other goods increased $1.3 billion.
- Industrial supplies and materials increased $1.2 billion.
- Crude oil increased $1.0 billion.
Imports of services increased $0.3 billion to $47.9 billion in April.
- Transport increased $0.1 billion.
- Other business services increased $0.1 billion.
- Charges for the use of intellectual property increased $0.1 billion.
Goods by Selected Countries and Areas: Monthly – Census Basis (Exhibit 19)
The April figures show surpluses, in billions of dollars, with South and Central America ($4.1), Hong Kong ($2.2), United Kingdom ($0.9), Singapore ($0.7), and Brazil ($0.6). Deficits were recorded, in billions of dollars, with China ($30.8), European Union ($13.2), Mexico ($6.0), Japan ($5.9), Germany ($5.6), OPEC ($3.3), Italy ($2.4), India ($2.0), Canada ($1.7), France ($1.6), South Korea ($1.3), Taiwan ($1.1), and Saudi Arabia ($0.9).
- The deficit with China decreased $3.4 billion to $30.8 billion in April. Exports decreased $1.4 billion to $11.1 billion and imports decreased $4.7 billion to $41.9 billion.
- The surplus with South and Central America increased $1.0 billion to $4.1 billion in April. Exports increased $0.7 billion to $14.0 billion and imports decreased $0.3 billion to $9.9 billion.
- The deficit with members of OPEC increased $2.1 billion to $3.3 billion in April. Exports decreased $0.3 billion to $4.6 billion and imports increased $1.8 billion to $7.9 billion.
Updates to Goods and Services
In this release and in the accompanying “U.S. International Trade in Goods and Services: Annual Revision” release (FT-900 Annual Revision), the U.S. Census Bureau and the U.S. Bureau of Economic Analysis (BEA) are publishing revised statistics on trade in goods and services. With these releases, statistics on trade in goods on a Census basis are revised beginning with 2015, and statistics on trade in goods on a balance of payments (BOP) basis and on trade in services are revised beginning with 2010.
On an annual basis for 2010–2017, the goods and services deficit was revised less than 1 percent for all years except for 2017 when it was revised down 3 percent. The goods deficit was revised down for most years but revised up for 2011 and 2015. The services surplus was revised down for 2010–2014 and up for 2015–2017.
NOTE: All statistics referenced are seasonally adjusted; statistics are on a balance of payments basis unless otherwise specified.
Page Last Revised - October 8, 2021
✕
Is this page helpful?
 Yes
Yes
 No
No
 Yes
Yes
 No
No✕
NO THANKS
255 characters maximum
 255 characters maximum reached
✕
Thank you for your feedback.
Comments or suggestions?

Comments or suggestions?