
Official websites use .gov
A .gov website belongs to an official government organization in the United States.
Secure .gov websites use HTTPS
A lock (
) or https:// means you’ve safely connected to the .gov website. Share sensitive information only on official, secure websites.

Topics
Data & Maps
Surveys & Programs
Resource Library
The Goods and Services Deficit Decreased to $49.0 billion in March 2018
The Goods and Services Deficit Decreased to $49.0 billion in March 2018
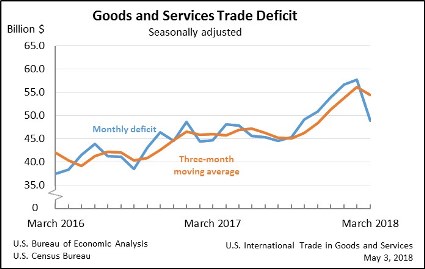
The U.S. Census Bureau and the U.S. Bureau of Economic Analysis announced today that the goods and services deficit was $49.0 billion in March, down $8.8 billion from $57.7 billion in February, revised.
Exports, Imports, and Balance (Exhibit 1)
March exports were $208.5 billion, $4.2 billion more than February exports. March imports were $257.5 billion, $4.6 billion less than February imports.
The March decrease in the goods and services deficit reflected a decrease in the goods deficit of $7.5 billion to $69.5 billion and an increase in the services surplus of $1.3 billion to $20.5 billion.
Year-to-date, the goods and services deficit increased $25.5 billion, or 18.5 percent, from the same period in 2017. Exports increased $39.2 billion or 6.8 percent. Imports increased $64.7 billion or 9.1 percent.
Exports (Exhibits 3, 6, and 7)
Exports of goods increased $3.7 billion to $140.9 billion in March.
Exports of goods on a Census basis increased $3.9 billion.
- Capital goods increased $1.9 billion.
- Civilian aircraft increased $1.9 billion.
- Foods, feeds, and beverages increased $1.0 billion.
- Soybeans increased $0.5 billion.
- Corn increased $0.3 billion.
- Industrial supplies and materials increased $0.9 billion.
- Crude oil increased $0.4 billion.
- Other petroleum products increased $0.3 billion.
Exports of services increased $0.4 billion to $67.6 billion in March.
- Maintenance and repair services increased $0.1 billion.
- Travel (for all purposes including education) increased $0.1 billion.
- Transport increased $0.1 billion.
Imports (Exhibits 4, 6, and 8)
Imports of goods decreased $3.7 billion to $210.4 billion in March.
Imports of goods on a Census basis decreased $3.6 billion.
- Capital goods decreased $1.5 billion.
- Computer accessories decreased $0.5 billion.
- Telecommunications equipment decreased $0.5 billion.
- Semiconductors decreased $0.5 billion.
- Consumer goods decreased $0.9 billion.
- Toys, games, and sporting goods decreased $0.7 billion.
- Televisions and video equipment decreased $0.7 billion.
- Industrial supplies and materials decreased $0.7 billion.
- Crude oil decreased $0.5 billion.
Imports of services decreased $0.9 billion to $47.1 billion in March.
- Charges for the use of intellectual property decreased $0.9 billion. Charges for February included payments for the rights to broadcast the 2018 Winter Olympic Games.
- Transport decreased $0.1 billion.
Goods by Selected Countries and Areas: Monthly – Census Basis (Exhibit 19)
The March figures show surpluses, in billions of dollars, with Hong Kong ($3.3), South and Central America ($3.1), United Kingdom ($1.2), Brazil ($0.8), and Singapore ($0.3). Deficits were recorded, in billions of dollars, with China ($35.4), European Union ($12.4), Mexico ($7.0), Japan ($5.9), Germany ($5.0), Italy ($2.3), France ($1.5), OPEC ($1.4), India ($1.4), Taiwan ($1.3), South Korea ($1.2), Saudi Arabia ($0.3), and Canada ($0.2).
- The deficit with Germany decreased $1.6 billion to $5.0 billion in March. Exports increased $0.4 billion to $5.1 billion and imports decreased $1.2 billion to $10.1 billion.
- The deficit with members of OPEC decreased $0.8 billion to $1.4 billion in March. Exports increased $0.4 billion to $4.9 billion and imports decreased $0.4 billion to $6.3 billion.
- The deficit with China increased $0.7 billion to $35.4 billion in March. Exports increased $1.6 billion to $12.4 billion and imports increased $2.3 billion to $47.7 billion.
Page Last Revised - October 8, 2021
✕
Is this page helpful?
 Yes
Yes
 No
No
 Yes
Yes
 No
No✕
NO THANKS
255 characters maximum
 255 characters maximum reached
✕
Thank you for your feedback.
Comments or suggestions?

Comments or suggestions?