The Goods and Services Deficit Increased to $53.1 billion in December 2017
The Goods and Services Deficit Increased to $53.1 billion in December 2017
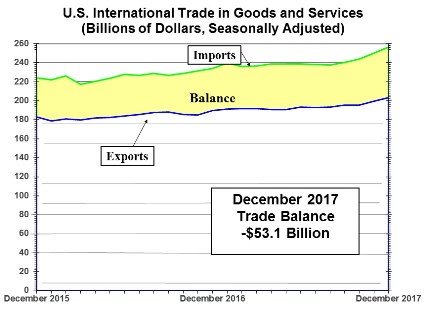
The U.S. Census Bureau and the U.S. Bureau of Economic Analysis, through the Department of Commerce, announced today that the goods and services deficit was $53.1 billion in December, up $2.7 billion from $50.4 billion in November, revised. December exports were $203.4 billion, $3.5 billion more than November exports. December imports were $256.5 billion, $6.2 billion more than November imports.
The December increase in the goods and services deficit reflected an increase in the goods deficit of $2.6 billion to $73.3 billion and a decrease in the services surplus of $0.1 billion to $20.2 billion.
Annual Summary for 2017
For 2017, the goods and services deficit was $566.0 billion, up $61.2 billion from $504.8 billion in 2016. Exports were $2,329.3 billion in 2017, up $121.2 billion from 2016. Imports were $2,895.3 billion in 2017, up $182.5 billion from 2016.
The 2017 increase in the goods and services deficit reflected an increase in the goods deficit of $57.5 billion or 7.6 percent to $810.0 billion and a decrease in the services surplus of $3.7 billion or 1.5 percent to $244.0 billion.
As a percentage of U.S. gross domestic product, the goods and services deficit was 2.9 percent in 2017, up from 2.7 percent in 2016.

Exports (Exhibits 3, 6, and 7 in the FT-900)
Exports of goods increased $95.7 billion to $1,551.4 billion in 2017.
Exports of goods on a Census basis increased $95.8 billion.
- Industrial supplies and materials increased $66.4 billion.
- Crude oil increased $12.4 billion.
- Other petroleum products increased $8.7 billion.
- Fuel oil increased $8.6 billion.
- Capital goods increased $13.2 billion.
- Other industrial machines increased $6.6 billion.
- Civilian aircraft engines increased $4.4 billion.
Exports of services increased $25.5 billion to $777.9 billion in 2017.
- Other business services, which includes research and development services; professional and management services; and technical, trade-related, and other services, increased $13.3 billion.
- Financial services increased $6.0 billion.
- Telecommunications, computer, and information services increased $2.2 billion.
Imports (Exhibits 4, 6, and 8 in the FT-900)
Imports of goods increased $153.2 billion to $2,361.5 billion in 2017.
Imports of goods on a Census basis increased $155.1 billion.
- Industrial supplies and materials increased $64.3 billion.
- Crude oil increased $31.0 billion.
- Capital goods increased $50.7 billion.
- Computers increased $8.1 billion.
- Other industrial machines increased $7.4 billion.
- Consumer goods increased $18.6 billion.
- Cell phones and other household goods increased $9.5 billion.
Imports of services increased $29.2 billion to $533.9 billion in 2017.
- Travel (for all purposes including education) increased $11.7 billion.
- Charges for the use of intellectual property increased $4.9 billion.
- Transport increased $4.0 billion.
Goods by Selected Countries and Areas: Census Basis (Exhibit 19)
The 2017 figures show surpluses, in billions of dollars, with South and Central America ($34.3), Hong Kong ($32.5), Netherlands ($24.5), Belgium ($14.8), and Australia ($14.6). Deficits were recorded, in billions of dollars, with China ($375.2), European Union ($151.4), Mexico ($71.1), Japan ($68.8), Germany ($64.3), Ireland ($38.1), Italy ($31.6), Malaysia ($24.6), India ($22.9), South Korea ($22.9), Thailand ($20.4), Canada ($17.6), Taiwan ($16.7), France ($15.3), Switzerland ($14.3), Indonesia ($13.3), and OPEC ($13.0).
- The deficit with China increased $28.2 billion to $375.2 billion in 2017. Exports increased $14.8 billion to $130.4 billion and imports increased $43.0 billion to $505.6 billion.
- The deficit with Mexico increased $6.7 billion to $71.1 billion in 2017. Exports increased $13.3 billion to $243.0 billion and imports increased $20.0 billion to $314.0 billion.
NOTE: All statistics referenced are seasonally adjusted; statistics are on a balance of payments basis unless otherwise specified.