
Official websites use .gov
A .gov website belongs to an official government organization in the United States.
Secure .gov websites use HTTPS
A lock (
) or https:// means you’ve safely connected to the .gov website. Share sensitive information only on official, secure websites.

Topics
Data & Maps
Surveys & Programs
Resource Library
The Goods and Services Deficit Increased to $43.7 billion in July 2017
The Goods and Services Deficit Increased to $43.7 billion in July 2017
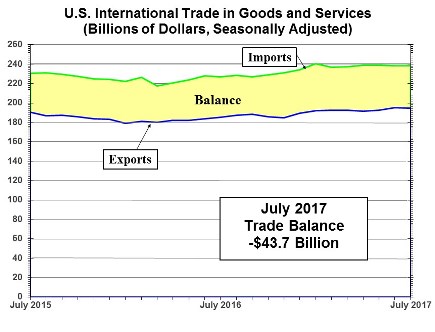
The U.S. Census Bureau and the U.S. Bureau of Economic Analysis, through the Department of Commerce, announced today that the goods and services deficit was $43.7 billion in July, up $0.1 billion from $43.5 billion in June, revised. July exports were $194.4 billion, $0.6 billion less than June exports. July imports were $238.1 billion, $0.4 billion less than June imports.
The July increase in the goods and services deficit reflected a decrease in the goods deficit of less than $0.1 billion to $65.3 billion and a decrease in the services surplus of $0.2 billion to $21.6 billion.
Exports (Exhibits 3, 6, and 7 in the FT-900)
Exports of goods decreased $0.4 billion to $128.6 billion in July.
Exports of goods on a Census basis decreased $0.4 billion to $128.6 billion.
- Consumer goods decreased $0.7 billion.
- Cell phones and other household goods decreased $0.5 billion.
- Automotive vehicles, parts, and engines decreased $0.6 billion.
- Passenger cars decreased $1.0 billion.
- Capital goods increased $0.9 billion.
- Civilian aircraft increased $1.1 billion.
Exports of services decreased $0.1 billion to $65.8 billion in July.
- Travel (for all purposes including education) decreased $0.3 billion.
- Other business services, which includes research and development services; professional and management services; and technical, trade-related, and other services, increased $0.2 billion
Imports (Exhibits 4, 6, and 8 in the FT-900)
Imports of goods decreased $0.5 billion to $193.9 billion in July.
Imports of goods on a Census basis decreased $0.4 billion.
- Automotive vehicles, parts, and engines decreased $0.8 billion.
- Passenger cars decreased $0.8 billion.
- Industrial supplies and materials decreased $0.7 billion.
- Crude oil decreased $1.0 billion.
- Capital goods increased $1.3 billion.
- Computer accessories increased $0.6 billion.
- Computers increased $0.6 billion.
Imports of services increased less than $0.1 billion to $44.1 billion in July. The changes in all categories were $0.1 billion or less and nearly offsetting.
Goods by Selected Countries and Areas: Census Basis (Exhibit 19)
The July figures show surpluses, in billions of dollars, with South and Central America ($3.5), Hong Kong ($2.8), Brazil ($0.8), Saudi Arabia ($0.8), and Singapore ($0.7). Deficits were recorded, in billions of dollars, with China ($31.8), European Union ($12.1), Japan ($5.5), Mexico ($5.4), Germany ($5.3), Italy ($2.4), India ($1.9), Taiwan ($1.9), South Korea ($1.8), France ($1.3), Canada ($0.9), United Kingdom ($0.2), and OPEC ($0.1).
- The surplus with South and Central America increased $0.9 billion to $3.5 billion in July. Exports increased $1.0 billion to $12.9 billion and imports increased $0.1 billion to $9.4 billion.
- The balance with Saudi Arabia shifted from a deficit of less than $0.1 billion to a surplus of $0.8 billion in July. Exports increased $0.4 billion to $1.9 billion and imports decreased $0.4 billion to $1.2 billion.
Page Last Revised - October 8, 2021
✕
Is this page helpful?
 Yes
Yes
 No
No
 Yes
Yes
 No
No✕
NO THANKS
255 characters maximum
 255 characters maximum reached
✕
Thank you for your feedback.
Comments or suggestions?

Comments or suggestions?