Accessing USA Trade Online Data
Accessing USA Trade Online Data
When you know how to navigate the USA Trade Online website, you can readily find the data you need. This blog presents an example of how you can retrieve USA Trade Online data.
In this example, we show data for five commodity numbers, covering three years, with a list of countries, for either imports or exports. We are using a table format to show the data, but you can also retrieve data as a .csv file that can be opened in Microsoft Excel. Remember, the data available in USA Trade Online is free for you to use.
Log in to <usatrade.census.gov>.
A. Get Started
Note: If you have already created and activated your account, skip to Step 3.
- Select “SIGN-UP NOW.”
- Complete the online form and you will receive an email to activate your account. Once you receive the email, follow the instructions to set up a password for your account.
- Log in using your account information.
- Select “Access Data” if it appears. Otherwise, go to the next step.
B. Select the Data
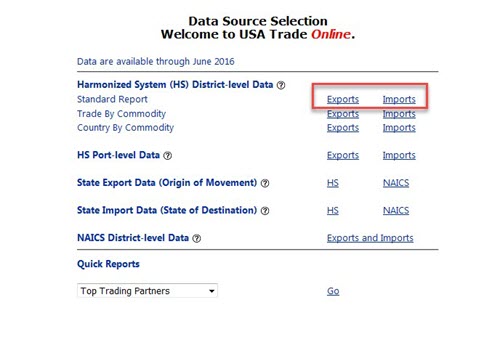
- On the Data Source Selection page, click “Exports” or “Imports” next to “Standard Report.”
In the next step, we are going to pull together a report that displays select commodities by country as well as by world total (except the United States and its territories). This report will cover three years so that you can see the trends of the commodities for that period.
2. Select commodities:
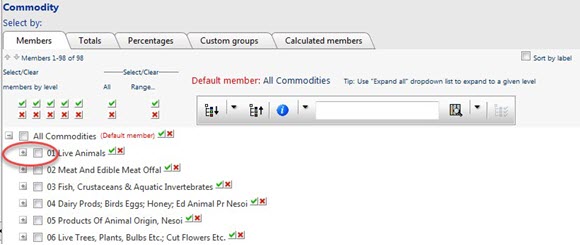
- Click to check the boxes next to the commodities for the data you want, for example, 01 through 05.
Note: The + icon allows you to expand the selection to four-, six-, and 10-digit commodity codes. The – icon shortens your selections.
If you need to start over, click on the “USA Trade Home” button and go to step four in section A.
3. Select countries:
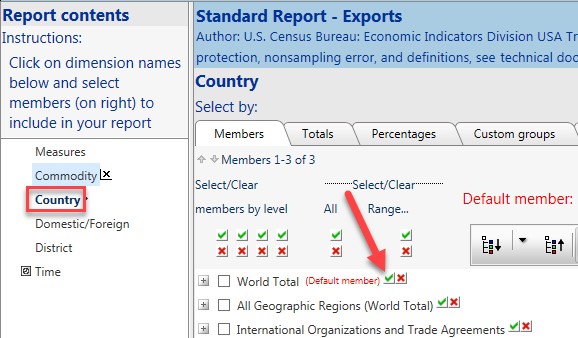
- Click on “Country” in the menu on the left under “Report contents” to make your country selections.
- Click on the green check mark next to “World Total.” This feature selects all countries including the world total.
Note: To select individual countries, click on the + icon next to “World Total.” To deselect “World Total” and all countries, click the red “x” next to “World Total.”
5. When you have selected the desired elements, click on “Report” at the top of the screen to view your data.
Note: If “Report” does not appear, maximize your screen or click on “Data Tools, Developers.”
C. Present the Table in an Easy-to-Read Format
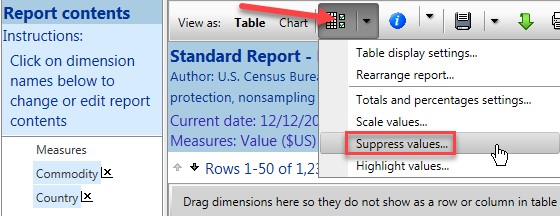
- Click the drop-down menu on the tool bar at the top of the screen and select “Rearrange report.” This feature will allow you to change the table layout.
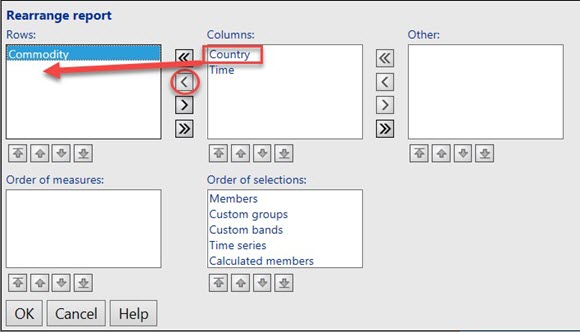
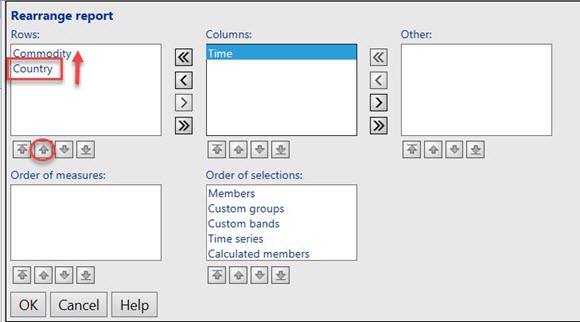
2. Highlight the “Country” variable and move it to the “Rows” box.
Note: Use the arrow buttons to toggle between “Rows,” “Columns” and “Other” boxes. Variables designated as “Other” do not appear as column or row headings. We recommend this layout for this tutorial. Customizing a report to your personal preferences may require trial and error.
3. Highlight the “Country” variable again and click the up arrow to move the “Country” variable on top. Then select “OK.”
4. On the same drop-down menu, select “Suppress values.” This function cleans your table by removing rows with no data.
- Click to check the box next to “Rows” and be sure that “Empty or Zero” (which is the default option) is selected.
- Select “OK.”
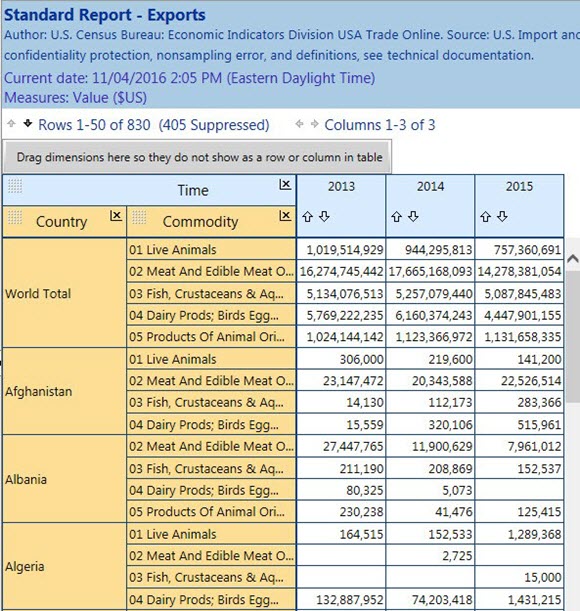
- See the “Table Format Example” at the end of this blog. Check to see if your countries and commodities are on the left side and your selected three years are shown across the page.
D. Download the Table to Excel
- Select the green down arrow on the “View as:” tool bar to download the data to Excel.
- Next to “Download format:” select “Comma-delimited ASCII format (*.csv)” for Excel.
- Next to “Data format:” select “Multi-dimensional.”
- Enter your email address or leave it blank so the data goes directly to your PC and then select “OK.”
- If you entered your email address check your email box for a message from USA Trade Online <eid.international.trade.data@census.gov>.
E. Additional Information on USA Trade Online
- User Guide: www.census.gov/foreign-trade/statistics/dataproducts/uto-help/uto-help.html
- New Features Guide: www.census.gov/foreign-trade/statistics/dataproducts/uto-help/new-feature-guide.pdf [1.0 MB]
- Contact the USA Trade Online Support Team at 1-800-549-0595, then select option 4.
Table Format Example
Below is an image that shows just the beginning of the table we created in the example. The five different export commodities are shown by world and by country, and you can see the value of each commodity for three years. Take a look at the “Live Animals” commodity. The results show that the United States exported over $1 billion worth of live animals in 2013. Look further down the chart and see that live animals were exported to Afghanistan and Algeria every year. Start the procedure over again, and get the facts you need from USA Trade Online. Download your results to Excel to make the data easier to use and manage.


