
Official websites use .gov
A .gov website belongs to an official government organization in the United States.
Secure .gov websites use HTTPS
A lock (
) or https:// means you’ve safely connected to the .gov website. Share sensitive information only on official, secure websites.

Topics
Data & Maps
Surveys & Programs
Resource Library
The Goods and Services Deficit Decreased to $44.3 billion in December 2016
The Goods and Services Deficit Decreased to $44.3 billion in December 2016
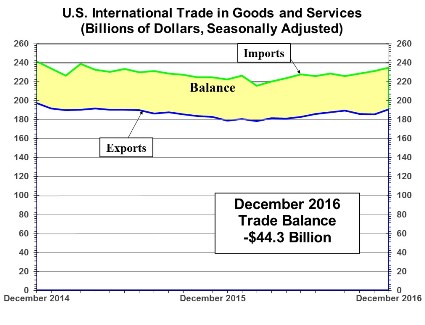
The U.S. Census Bureau and the U.S. Bureau of Economic Analysis, through the Department of Commerce, announced today that the goods and services deficit was $44.3 billion in December, down $1.5 billion from $45.7 billion in November, revised. December exports were $190.7 billion, $5.0 billion more than November exports. December imports were $235.0 billion, $3.6 billion more than November imports.
The December decrease in the goods and services deficit reflected a decrease in the goods deficit of $1.2 billion to $65.7 billion and an increase in the services surplus of $0.3 billion to $21.4 billion.
Annual Summary for 2016
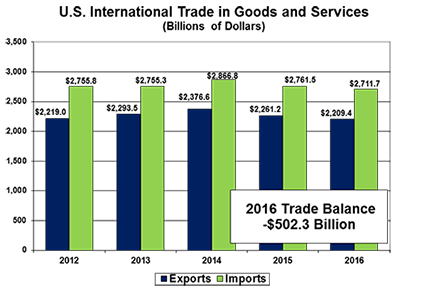
For 2016, the goods and services deficit increased $1.9 billion, or 0.4 percent, from 2015. Exports decreased $51.7 billion or 2.3 percent. Imports decreased $49.9 billion or 1.8 percent.
For 2016, the goods and services deficit was $502.3 billion, up $1.9 billion from $500.4 billion in 2015. Exports were $2,209.4 billion in 2016, down $51.7 billion from 2015. Imports were $2,711.7 billion in 2016, down $49.9 billion from 2015.
The 2016 increase in the goods and services deficit reflected a decrease in the goods deficit of $12.5 billion or 1.6 percent to $750.1 billion and a decrease in the services surplus of $14.4 billion or 5.5 percent to $247.8 billion.
Exports (Exhibits 3, 6, and 7 in the FT-900)
Exports of goods increased $4.8 billion to $126.9 billion in December.
Exports of goods on a Census basis increased $4.9 billion.
- Capital goods increased $3.3 billion.
- Civilian aircraft increased $1.0 billion.
- Engines for civilian aircraft increased $1.0 billion.
- Industrial supplies and materials increased $0.7 billion.
- Natural gas increased $0.2 billion.
- Fuel oil increased $0.2 billion.
Exports of services increased $0.2 billion to $63.8 billion in December.
- Transport, which includes freight and port services and passenger fares, increased $0.1 billion.
- Travel (for all purposes including education) increased $0.1 billion.
Imports (Exhibits 4, 6, and 8 in the FT-900)
Imports of goods increased $3.6 billion to $192.6 billion in December.
Imports of goods on a Census basis increased $3.7 billion.
- Automotive vehicles, parts, and engines increased $1.6 billion.
- Passenger cars increased $1.4 billion.
- Industrial supplies and materials increased $1.1 billion.
- Natural gas increased $0.4 billion.
- Fertilizers, pesticides, and insecticides increased $0.4 billion.
- Capital goods increased $1.0 billion.
Imports of services were nearly unchanged at $42.3 billion in December.
- The change in each category was less than $0.1 billion.
Goods by Selected Countries and Areas: Census Basis (Exhibit 19)
The December figures show surpluses, in billions of dollars, with Hong Kong ($2.1), South and Central America ($1.0), Singapore ($0.9), Saudi Arabia ($0.4), and Brazil ($0.2). Deficits were recorded, in billions of dollars, with China ($30.2), European Union ($12.9), Japan ($6.8), Germany ($5.2), Mexico ($4.6), Italy ($2.8), India ($2.0), South Korea ($1.8), Canada ($1.5), Taiwan ($1.0), OPEC ($1.0), France ($0.7), and United Kingdom ($0.2).
- The deficit with Canada decreased $1.7 billion to $1.5 billion in December. Exports increased $1.0 billion to $22.4 billion and imports decreased $0.7 billion to $23.8 billion.
- The deficit with Mexico decreased $1.2 billion to $4.6 billion in December. Exports increased $1.6 billion to $20.7 billion and imports increased $0.5 billion to $25.2 billion.
NOTE: All statistics referenced are seasonally adjusted; statistics are on a balance of payments basis unless otherwise specified.
Page Last Revised - October 8, 2021
✕
Is this page helpful?
 Yes
Yes
 No
No
 Yes
Yes
 No
No✕
NO THANKS
255 characters maximum
 255 characters maximum reached
✕
Thank you for your feedback.
Comments or suggestions?

Comments or suggestions?