
Official websites use .gov
A .gov website belongs to an official government organization in the United States.
Secure .gov websites use HTTPS
A lock (
) or https:// means you’ve safely connected to the .gov website. Share sensitive information only on official, secure websites.

Topics
Data & Maps
Surveys & Programs
Resource Library
The Goods and Services Deficit Decreased to $41.9 billion in July 2015
The Goods and Services Deficit Decreased to $41.9 billion in July 2015
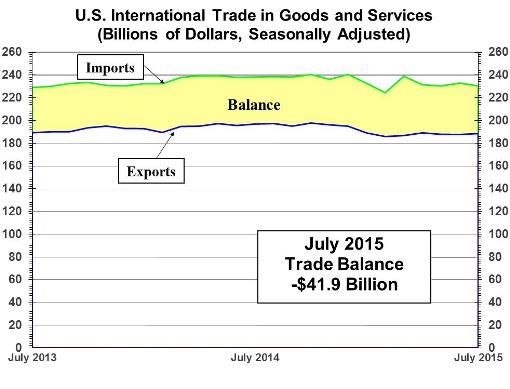
The U.S. Census Bureau and the U.S. Bureau of Economic Analysis, through the Department of Commerce, announced today that the goods and services deficit was $41.9 billion in July, down $3.3 billion from $45.2 billion in June, revised. July exports were $188.5 billion, $0.8 billion more than June exports. July imports were $230.4 billion, $2.5 billion less than June imports.
The July decrease in the goods and services deficit reflected a decrease in the goods deficit of $3.4 billion to $61.4 billion and a decrease in the services surplus of less than $0.1 billion to $19.6 billion.
Year-to-date, the goods and services deficit increased $10.6 billion, or 3.6 percent, from the same period in 2014. Exports decreased $47.0 billion or 3.5 percent. Imports decreased $36.4 billion or 2.2 percent.
Exports of goods increased $0.6 billion to $128.2 billion in July.
Exports of goods on a Census basis increased $1.0 billion.
- Automotive vehicles, parts, and engines increased $0.6 billion.
-
Industrial supplies and materials increased $0.3 billion.
- Nonmonetary gold increased $0.3 billion.
- Consumer goods decreased $0.4 billion.
Net balance of payments adjustments decreased $0.4 billion.
Exports of services increased $0.2 billion to $60.3 billion in July.
- Financial services increased $0.1 billion.
- Other business services, which includes research and development services; professional and management services; and technical, trade-related, and other services, increased $0.1 billion.
Imports of goods decreased $2.7 billion to $189.6 billion in July.
Imports of goods on a Census basis decreased $2.1 billion.
- Consumer goods decreased $2.6 billion.
o Pharmaceutical preparations decreased $1.5 billion.
o Cell phones and other household goods decreased $1.3 billion
Net balance of payments adjustments decreased $0.6 billion.
Imports of services increased $0.2 billion to $40.8 billion in July.
- Travel (for all purposes including education) increased $0.1 billion.
- Transport, which includes freight and port services and passenger fares, increased $0.1 billion.
The July figures show surpluses, in billions of dollars, with South and Central America ($2.6), OPEC ($0.7), United Kingdom ($0.3), and Brazil ($0.2). Deficits were recorded, in billions of dollars, with China ($28.8), European Union ($12.4), Germany ($6.0), Japan ($5.4), Mexico ($3.8), Italy ($2.3), South Korea ($2.2), Canada ($2.1), India ($2.0), France ($1.1), and Saudi Arabia ($0.5).
- The deficit with Mexico decreased $1.6 billion to $3.8 billion in July. Exports increased $0.7 billion to $20.7 billion and imports decreased $0.9 billion to $24.5 billion.
- The deficit with the European Union decreased $1.4 billion to $12.4 billion in July. Exports increased $0.5 billion to $22.4 billion and imports decreased $1.0 billion to $34.8 billion.
NOTE: All statistics referenced are seasonally adjusted; statistics are on a balance of payments basis unless otherwise specified.
Page Last Revised - December 16, 2021
✕
Is this page helpful?
 Yes
Yes
 No
No
 Yes
Yes
 No
No✕
NO THANKS
255 characters maximum
 255 characters maximum reached
✕
Thank you for your feedback.
Comments or suggestions?

Comments or suggestions?