
Official websites use .gov
A .gov website belongs to an official government organization in the United States.
Secure .gov websites use HTTPS
A lock (
) or https:// means you’ve safely connected to the .gov website. Share sensitive information only on official, secure websites.

Topics
Data & Maps
Surveys & Programs
Resource Library
Goods and Services Deficit decreased in April 2015
Goods and Services Deficit decreased in April 2015
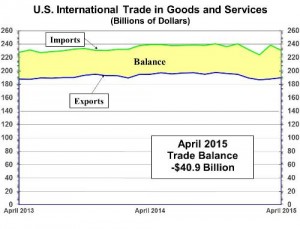
The U.S. Census Bureau and the U.S. Bureau of Economic Analysis, through the Department of Commerce, announced today that the goods and services deficit was $40.9 billion in April, down $9.7 billion from $50.6 billion in March, revised. April exports were $189.9 billion, $1.9 billion more than March exports. April imports were $230.8 billion, $7.8 billion less than March imports.
The April decrease in the goods and services deficit reflected a decrease in the goods deficit of $9.3 billion to $60.7 billion and an increase in the services surplus of $0.4 billion to $19.8 billion.
Year-to-date, the goods and services deficit increased $1.5 billion, or 0.9 percent, from the same period in 2014. Exports decreased $18.0 billion or 2.3 percent. Imports decreased $16.5 billion or 1.8 percent.
Exports of goods increased $1.9 billion to $129.0 billion in April.
Exports of goods on a Census basis increased $2.1 billion.
-
Capital goods increased $2.1 billion.
- Civilian aircraft increased $1.0 billion.
- Telecommunications equipment increased $0.6 billion.
- Other industrial machines increased $0.3 billion.
Net balance of payments adjustments decreased $0.2 billion.
Exports of services increased less than $0.1 billion to $60.9 billion in April.
- Other business services increased $0.1 billion.
- Transport, which includes freight and port services and passenger fares, decreased $0.2 billion.
Imports of goods decreased $7.4 billion to $189.6 billion in April.
Imports of goods on a Census basis decreased $7.5 billion.
-
Consumer goods decreased $4.9 billion.
- Cell phones and other household goods decreased $1.3 billion.
- Other textile apparel and household goods decreased $0.9 billion.
- Footwear decreased $0.8 billion
Net balance of payments adjustments increased $0.1 billion.
Imports of services decreased $0.4 billion to $41.1 billion in April.
- Transport decreased $0.5 billion.
- Travel (for all purposes including education) increased $0.1 billion.
The April figures show surpluses, in billions of dollars, with South and Central America ($3.0), Brazil ($0.8), and OPEC ($0.5). Deficits were recorded, in billions of dollars, with China ($27.5), European Union ($11.9), Japan ($6.7), Germany ($5.9), Mexico ($4.2), Italy ($2.2), South Korea ($2.1), India ($1.5), France ($1.1), United Kingdom ($1.0), Canada ($0.3), and Saudi Arabia ($0.1).
The deficit with China decreased $11.4 billion to $27.5 billion in April. Exports increased $0.9 billion to $10.3 billion and imports decreased $10.5 billion to $37.7 billion.
- The deficit with European Union increased $1.0 billion to $11.9 billion in April. Exports increased $0.9 billion to $23.6 billion and imports increased $1.9 billion to $35.6 billion.
In the “U.S. International Trade in Goods and Services: April 2015” and in the accompanying “U.S. International Trade in Goods and Services: Annual Revision for 2014” release, the U.S. Census Bureau and the U.S. Bureau of Economic Analysis (BEA) are publishing revised statistics on U.S. trade in goods for January 2012 to March 2015 and revised statistics on U.S. trade in services for January 1999 to March 2015. The revised statistics will also be included in the report “U.S. International Transactions: First Quarter 2015 and Annual Revisions” and in the international transactions interactive database on BEA’s Web site, both to be released by BEA on June 18, 2015.
This annual revision has not changed the overall trend in the goods and services balance. On an annual basis, the goods and services deficit was revised downward 0.2 percent for 2012 and was revised upward 0.4 percent for 2013 and 0.7 percent for 2014. The goods deficit was revised downward for 2012 and was revised upward for 2013 and 2014; the services surplus was nearly unrevised for 2012, was revised downward for 2013, and was revised upward for 2014. Revisions for 1999–2011 did not impact the goods and services totals or balances.
NOTE: All statistics referenced are seasonally adjusted; statistics are on a balance of payments basis unless otherwise specified.
Page Last Revised - December 16, 2021
✕
Is this page helpful?
 Yes
Yes
 No
No
 Yes
Yes
 No
No✕
NO THANKS
255 characters maximum
 255 characters maximum reached
✕
Thank you for your feedback.
Comments or suggestions?

Comments or suggestions?