
Official websites use .gov
A .gov website belongs to an official government organization in the United States.
Secure .gov websites use HTTPS
A lock (
) or https:// means you’ve safely connected to the .gov website. Share sensitive information only on official, secure websites.

Topics
Data & Maps
Surveys & Programs
Resource Library
2013 Trade Deficit the Lowest Since 2009
2013 Trade Deficit the Lowest Since 2009
The Nation’s international trade deficit in goods and services decreased to $471.5 billion in 2013 from $534.7 billion in 2012. Exports increased $61.7 billion to $2.3 trillion in 2013. Increases of $7.1 billion in industrial supplies and materials and $6.8 billion in consumer goods contributed to the overall increase in exports. Increases in exports of fuel oil, petroleum products, natural gas, and crude oil drove the increase in industrial supplies and materials. Increases in gem diamonds and cell phones drove the increase in consumer goods. Imports decreased $1.4 billion to $2.7 trillion in 2013. A $49.0 billion decrease in imports of industrial supplies and materials was the main contributor to the overall decrease. Specifically, imports of crude oil decreased by $40.3 billion.
There were many annual trade highlights in 2013. The 2013 goods and services deficit was the lowest since 2009. 2013 exports of goods and services ($2,272.3 billion) were the highest on record. The 2013 deficit with China ($318.4 billion) and surplus with South and Central America ($25.8 billion) were the highest on record. You can find these and many more highlights on our Annual Press Highlights page.
December Graph of the Month
Our December Graph of the Month highlights the record annual surplus with South and Central America. As you can see in the graph, the U.S. trade balance with South and Central America has gone from a $5.5 billion deficit in 2011 to a $25.8 billion surplus in 2013.
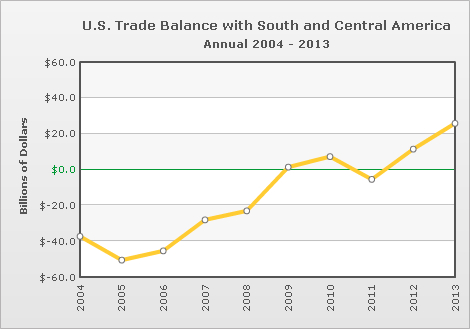
December 2013 Graph of the Month
Monthly Trade Deficit Increased in December
In December, the Nation’s international trade deficit in goods and services increased to $38.7 billion as exports decreased and imports increased. Exports decreased $3.5 billion to $191.3 billion in December, due in part to a decrease in industrial supplies and materials ($1.1 billion). Imports increased $0.6 billion to $230.0 billion, led by a $0.7 billion increase in consumer goods. December imports of consumer goods ($45.7 billion) were the highest on record.
As far as highlights go, December continued a recent trend with a third month in a row of record high exports of petroleum ($13.5 billion).
You can find more U.S. trade data online by visiting USATradeOnline. If you are a first time user, you are eligible for a one-week (7-day) free trail.
Page Last Revised - December 16, 2021
✕
Is this page helpful?
 Yes
Yes
 No
No
 Yes
Yes
 No
No✕
NO THANKS
255 characters maximum
 255 characters maximum reached
✕
Thank you for your feedback.
Comments or suggestions?

Comments or suggestions?