Deficit Increases in April
Deficit Increases in April
In April, the Nation’s international trade deficit increased to $40.3 billion from $37.1 billion in March, as imports increased more than exports. Imports increased $5.4 billion to $227.7 billion contributed by the $3.0 billion increase in consumer goods and $1.3 billion increase in automotive vehicles, parts, and engines. Meanwhile, exports increased $2.2 billion to $187.4 billion primarily due to record high exports in consumer goods ($16.8 billion) and automotive vehicles, parts, and engines ($12.8 billion).
Expanding the Scope of Annual Revisions
If you have not already read about our updated revision policy for goods on a Census Basis, you may be surprised to find that today’s releases of the U.S. International Trade in Goods and Services: for April 2013 and Annual Revision’s for 2012, have revised trade statistics for the prior three years (2010-2012) in our not seasonally adjusted series. The update marks a significant improvement from our prior revision policy by expanding the scope of goods revisions from one to three years. Therefore, there is potential for substantial impact on specific commodity level and other detailed Census products.
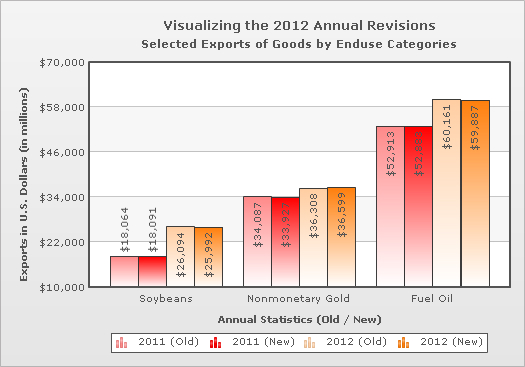
In April’s Graph of the Month, pictured below, we see how 2012’s Annual Revisions impact selected exports of goods by End-Use Categories. Notably, the revisions increased 2012 nonmonetary gold exports by $291 million and decreased 2011 nonmonetary gold exports by $160 million. Though revisions to these three End-Use Categories from the graph did not change more than 1% of their respected annual export trade in 2011 and 2012, there are Harmonized System (HS) commodities revised in excess of 20% of their annual export value. For instance, in 2010 Copper Wire (7408116000) increased 29.2% from $742.1 million to $959.1 million; and in 2011 Crude Petroleum (2709002090) increased 22.9% from $1,677.8 million to $2,061.8 million.
Our commodity data were not the only things affected by our updated revision policy. We also revised how we present our data to reflect the additional two years of revisions. Our revisions impacted multiple exhibits and data products. In particular, exhibits 6, 7, 13, 14, 15, 15a, 16, and 17 in the U.S. International Trade in Goods and Services: Annual Revision for 2012. See how our modified policy changed these exhibits by viewing them here.