
Official websites use .gov
A .gov website belongs to an official government organization in the United States.
Secure .gov websites use HTTPS
A lock (
) or https:// means you’ve safely connected to the .gov website. Share sensitive information only on official, secure websites.

Topics
Data & Maps
Surveys & Programs
Resource Library
Caution: HOT Commodity!
Caution: HOT Commodity!
What do people need most to get work done? COFFEE!
I personally love coffee. No matter what the time of day or where it comes from, there’s nothing like a fresh cup of coffee! A cup of coffee is the perfect excuse to bring together old friends, encourage you to tackle that pile of work or simply just to stay awake.
No matter how people use coffee, it adds up to BIG money in international trade. Guess it’s not just me who has found a special relationship with coffee–it’s a worldwide love affair!
Just How HOT Is Coffee?
Let’s look at the numbers to see just how much this commodity is traded. Using statistics from USATradeOnline, I pulled the trade data available for coffee (Schedule B Heading: 0901 for coffee, coffee husks, substitutes with coffee) for the geographic regions and the world total from 2003 to 2012.
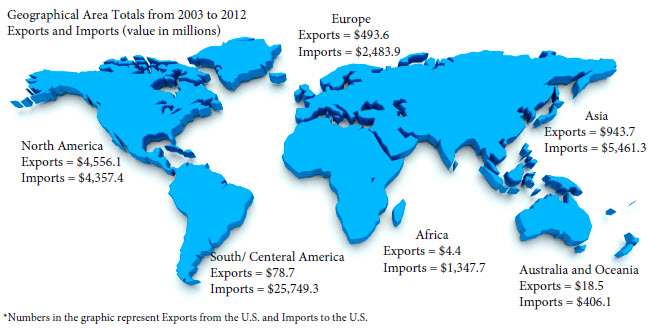
Just as expected, coffee is a HOT commodity (can’t help myself). But seriously, since 2003, coffee imports have increased reaching a high level in 2011 of $7.65 billion; that’s a 330% increase from $1.77 billion in 2003! Not only is the U.S. spending more on coffee, we have also increased our coffee export value since 2003 by 261% from $296 million to $1.07 billion in 2012.
Where Does the Coffee Come From?
Good question! Because the trade data we collect is so detailed, we can see which geographic regions supply the most coffee to the U.S. Although the number one spot goes to Latin America (South and Central America) – as you probably guessed already- the second spot seems to be more up for grabs. Asia and North America have swapped the second position in the trade totals for coffee since 2003 with Asia most often occupying the runner-up position. The smallest amount of coffee trade (imports and exports) comes from the same geographic region, Australia and Oceania.
Exports from the U.S. have increased dramatically as mentioned earlier. While the largest segment of coffee exports in volume goes to North America, the largest percentage change is seen with the Africa geographical region. From 2003 to 2012, this region increased coffee exports by more than 1400%! The largest change occurred from 2011 to 2012 when exports grew from $321 thousand to $1.59 million.
More Data
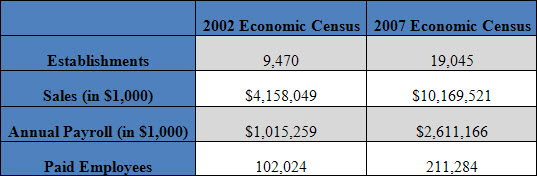
Okay so now that you’ve seen the numbers from the USATradeOnline data, let me show you a little more proof of just how big business coffee is . Using the American Fact Finder and looking at data provided from the 2002 and 2007 Economic Censuses, we can see growth in terms of number of establishments, sales, annual payroll and number of paid employees for the coffee industry in the U.S. The growth mimics what we see in the trade data. Economic Census Data for coffee shops (NAICS 7222135) in 2002 and in 2007 show:
Do you think your business can be competitive in the coffee market? Check out our data on USATradeOnline and American Fact Finder or research the trade information yourself at Export.gov and to see where your next market might be.
Coffee…it really is a HOT Commodity!
Page Last Revised - September 15, 2022
✕
Is this page helpful?
 Yes
Yes
 No
No
 Yes
Yes
 No
No✕
NO THANKS
255 characters maximum
 255 characters maximum reached
✕
Thank you for your feedback.
Comments or suggestions?

Comments or suggestions?