
Official websites use .gov
A .gov website belongs to an official government organization in the United States.
Secure .gov websites use HTTPS
A lock (
) or https:// means you’ve safely connected to the .gov website. Share sensitive information only on official, secure websites.

Topics
Data & Maps
Surveys & Programs
Resource Library
January Goods and Services Deficit Increases to Start 2013
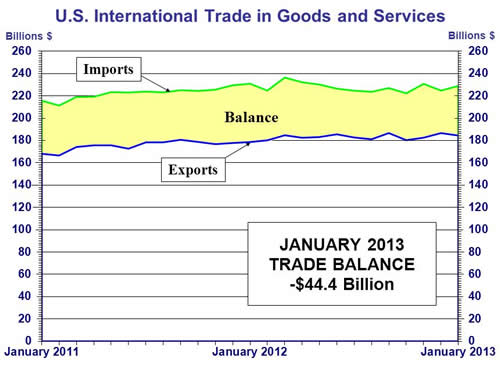
January Goods and Services Deficit Increases to Start 2013
The Nation’s international trade deficit in goods and services increased to $44.4 billion from $38.1 billion in December (revised). Exports decreased $2.1 billion to $184.5 billion in January, primarily due to the decrease of $2.6 billion in industrial supplies and materials. Meanwhile imports increased $4.1 billion to $228.9, largely due to an increase of $4.0 billion in industrial supplies and materials.
For more information, please visit www.census.gov/ft900.
Cellular Phone Imports Increase
January’s graph of the month highlights U.S. trade of cellphones. U.S. imports of cellphones have been rising from 2007 to 2012. Increases in imports were relatively small from 2011 to 2012. U.S. exports of cellphones increased over 54 percent from 2009 to 2010. To view January’s graph of the month, click on this link.
Changes to the FT-900
We would also like to mention that January is the first month on our accelerated release schedule. Beginning this month, our releases will be available an average of 35 calendar days after the end of the reference month. Click here to read more about our accelerated release.
January also marks the first month the U.S. Census Bureau will publish an updated version of Exhibit 15 in the FT-900: U.S. International Trade in Goods and Services. The commodity groupings and definitions have changed, but the general structure is still the same. Read more about the changes to Exhibit 15 here.
Page Last Revised - December 16, 2021
✕
Is this page helpful?
 Yes
Yes
 No
No
 Yes
Yes
 No
No✕
NO THANKS
255 characters maximum
 255 characters maximum reached
✕
Thank you for your feedback.
Comments or suggestions?

Comments or suggestions?