Trade Grows in November
Trade Grows in November
Overall, the deficit of goods and services increased to $48.7 billion in November from $42.1 billion in October (revised). Exports increased to $182.6 billion in November from $180.8 billion in October (revised). Exports saw the largest increases in both capital goods ($0.9 billion) and automotive vehicles, parts, and engines ($0.7 billion). Meanwhile, imports increased to $231.3 billion in November from $222.9 billion in October (revised). This $8.4 billion increase was due largely to the increased importation of consumer goods ($4.6 billion), automotive vehicles, parts, and engines ($1.5 billion), and industrial supplies and materials ($1.3 billion). For more in depth analysis, please go to www.census.gov/ft900
Consumers Consuming
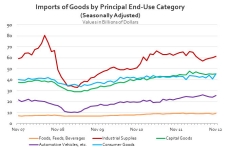
Imports of consumer goods hit a record high of $45.3 million in November. This was an increase of $4.6 million or 11.2%. This record high made me wonder how imports of other principal end-use categories were faring so I did a little research and put together the following graph.

As you can see, there was a significant drop across the spectrum starting in September 2008. Since that time, most of the commodity groupings have slowly risen and even passed their pre-recession levels. Even industrial supplies, which have not fully rebounded, have increased 84.8% from their low of $33.2 billion in May 2009. It will certainly be interesting to see if these trends continue in the future.
If you share my interest, please go to our website at www.census.gov/foreign-trade/statistics/historical. Here you can find monthly data from 1992-present for Goods by Principal End-Use Category.


