
Official websites use .gov
A .gov website belongs to an official government organization in the United States.
Secure .gov websites use HTTPS
A lock (
) or https:// means you’ve safely connected to the .gov website. Share sensitive information only on official, secure websites.

Topics
Data & Maps
Surveys & Programs
Resource Library
July 2012 Trade Data
July 2012 Trade Data
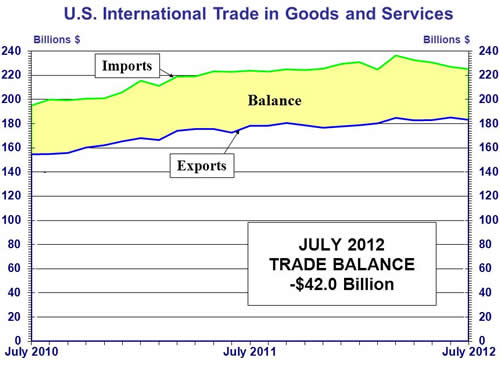
For July 2012, the trade deficit in goods and services increased to $42.0 billion from $41.9 billion (revised) in June, as exports decreased more than imports. Exports decreased to $183.3 billion and imports decreased to $225.3 billion.
July saw record exports of foods, feeds, and beverages ($12.9 billion). Specifically, July exports of soybeans ($4.1 billion) increased $2.0 billion from June. On the import side, imports of automotive vehicles, parts, and engines ($26.0 billion) were a record high for the third straight month.
In anticipation of Manufacturing Day on October 5th, July’s Graph of the Month highlights U.S. exports of manufactured goods. The graph shows how U.S. exports of manufactured goods have steadily increased since July 2009, on a year-to-date basis. You can find detailed data on U.S. exports of manufactured goods by visiting USA Trade Online.
For more highlights and to the view the entire release, check out the data page on the Foreign Trade Division website.
Page Last Revised - May 6, 2022
✕
Is this page helpful?
 Yes
Yes
 No
No
 Yes
Yes
 No
No✕
NO THANKS
255 characters maximum
 255 characters maximum reached
✕
Thank you for your feedback.
Comments or suggestions?

Comments or suggestions?