
Official websites use .gov
A .gov website belongs to an official government organization in the United States.
Secure .gov websites use HTTPS
A lock (
) or https:// means you’ve safely connected to the .gov website. Share sensitive information only on official, secure websites.

Topics
Data & Maps
Surveys & Programs
Resource Library
U.S. Trade Deficit Increases in November
U.S. Trade Deficit Increases in November
U.S. Trade November 2011
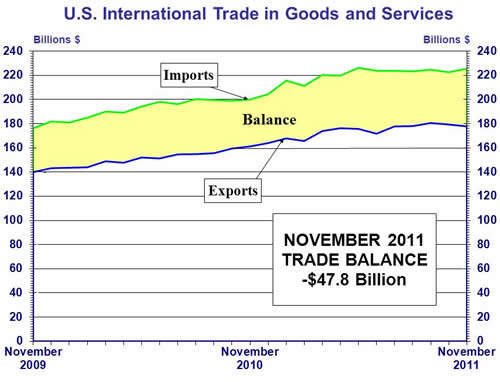
A decrease in November exports and an increase in imports resulted in a rise in the Nation’s international trade deficit in goods and services to $47.8 billion compared to $43.3 billion (revised) in October. November exports, $177.8 billion, were $1.5 billion less than October exports of $179.4 billion. November imports, $225.6 billion, were $2.9 billion more than October imports of $222.6 billion.
The decrease in exports of goods reflected decreases in industrial supplies and materials ($1.6 billion); capital goods ($0.2 billion); other goods ($0.2 billion); and automotive vehicles, parts, and engines ($0.2 billion). November saw a record high of exports of consumer goods ($15.7 billion) and exports to China ($9.9 billion) were the highest since December 2010 ($10.1 billion). The increase in imports of goods reflected increases in industrial supplies and materials ($2.7 billion); automotive vehicles, parts, and engines ($0.8 billion); other goods ($0.6 billion); and capital goods ($0.1 billion).
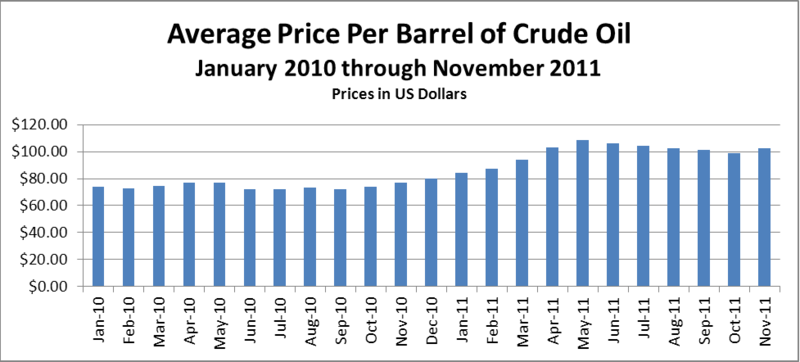
After five consecutive months of decreases, the October to November 2011 trade statistics show an increase in the average price per barrel of crude oil go from $98.84 to $102.5. This increase broke the downward trend that started in May 2011 when the average price per barrel of crude oil was $108.70. (See Exhibit 17 of the FT900). The graph below shows the average price per barrel of crude oil from January 2010 through November 2011.
Page Last Revised - December 16, 2021
✕
Is this page helpful?
 Yes
Yes
 No
No
 Yes
Yes
 No
No✕
NO THANKS
255 characters maximum
 255 characters maximum reached
✕
Thank you for your feedback.
Comments or suggestions?

Comments or suggestions?