
Official websites use .gov
A .gov website belongs to an official government organization in the United States.
Secure .gov websites use HTTPS
A lock (
) or https:// means you’ve safely connected to the .gov website. Share sensitive information only on official, secure websites.

Topics
Data & Maps
Surveys & Programs
Resource Library
Trade Deficit Decreases in October
Trade Deficit Decreases in October
U.S. Trade in October
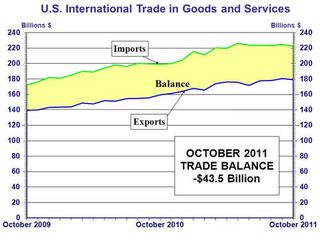
Decreases in both exports and imports led to the Nation’s international trade deficit in goods and services decreasing to $43.5 billion in October from $44.2 billion (revised) in September. Exports decreased $1.5 billion to $179.2 billion in October and imports decreased $2.2 billion to $222.6 billion.
The decrease in imports was primarily due to decreases in imports of crude oil (down $1.5 billion) and passenger cars (down $0.7 billion). Imports from China rose $1.4 billion in October to a record $37.8 billion, eclipsing the previous record of $37.4 billion set two months ago. Exports to China reached their highest level so far in 2011, at $9.7 billion. The record for exports to China in a single month is $10.1 billion, set in December 2010.
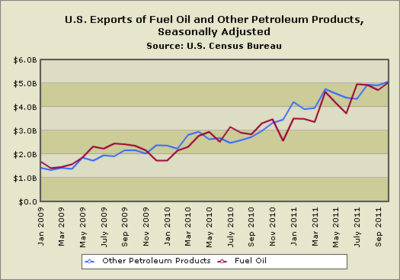
Despite the overall decrease in exports, October saw record exports of petroleum at $10.4 billion. October’s Graph of the Month looks at the increase since January 2009 of two categories of petroleum: Fuel Oil and Other Petroleum Products (basically, petroleum products except crude oil, fuel oil, and natural gas liquids.) Since January 2009, fuel oil exports have increased 198%, from $1.692 billion to $5.042 billion in October 2011. Other Petroleum Products have grown even more, up 256%, from $1.452 billion to $5.072 billion.
Click the image below for an interactive version of the graph.
Page Last Revised - December 16, 2021
✕
Is this page helpful?
 Yes
Yes
 No
No
 Yes
Yes
 No
No✕
NO THANKS
255 characters maximum
 255 characters maximum reached
✕
Thank you for your feedback.
Comments or suggestions?

Comments or suggestions?