An official website of the United States government
Here’s how you know
Official websites use .gov
A .gov website belongs to an official government organization in the United States.
Secure .gov websites use HTTPS
A lock (
) or https:// means you’ve safely connected to the .gov website. Share sensitive information only on official, secure websites.
-
//
- Census.gov /
- Census Blogs /
- Global Reach /
- May Trade Data Released
May Trade Data Released
May Trade Data Released

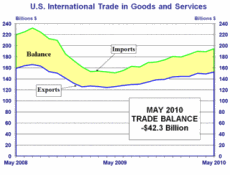
The Nation’s international trade deficit in goods and services increased to $42.3 billion in May 2010 from $40.3 billion (revised) in April, as imports increased more than exports.
Exports were up $3.5 billion in May, to $148.7 billion. The increase was mostly accounted for by increases in Capital Goods ($2.0 billion – including items such as industrial machines, medicinal equipment, and generator) and Industrial Supplies ($0.6 billion – including fuel oil, finished metal shapes, and plastic materials).
Imports were up $5.5 billion to $194.5 billion, despite a drop of $2.8 billion in petroleum imports. Crude oil imports alone fell $2.2 billion, to $20.9 billion in May from $23.1 billion. The import increase was led by increases in passenger cars ($1.3 billion), computers ($0.9 billion), and pharmaceutical preparations ($0.7 billion).
The petroleum deficit of $21.5 billion accounted for 50.8% of the goods and services deficit in May, the smallest percentage since it was 40.4% in January 2009. Since then, petroleum has accounted for as much as 63.2% of the total trade deficit, in December 2009, when the petroleum deficit was $23.5 billion and the overall deficit was $37.1 billion.
Share
 Yes
Yes
 No
NoComments or suggestions?


Top
