An official website of the United States government
Here’s how you know
Official websites use .gov
A .gov website belongs to an official government organization in the United States.
Secure .gov websites use HTTPS
A lock (
) or https:// means you’ve safely connected to the .gov website. Share sensitive information only on official, secure websites.
-
//
- Census.gov /
- Census Blogs /
- Global Reach /
- 2009: The Year in Trade
2009: The Year in Trade
2009: The Year in Trade

December 2009 trade data were released on February 10 (in the middle of a blizzard, no less!)
With the December release comes our chance to take a look back at a 2009 year-in-review. The annual trade data shows a marked dropoff from 2008. The December monthly stats show trade, and exports in particular, returning towards previous levels.
Since 1960, there have been only two years when the total trade in goods and services have declined from the year before: 1982 (5%) and 2001 (6%). In 2009, total trade declined 20%, from $4.3 trillion in 2008 to $3.5 trillion in 2009. On a nominal dollar basis, this is easily the biggest drop in trade ever seen in the United States. On a percentage basis, you have to go back to 1931/1932 to find a bigger drop , when trade declined 33% (from $6.8 to $4.5 billion).
However, the monthly data shows trade moving back toward pre-recession levels. After reaching an all-time high of $164.4 billion in July 2008, exports dropped 26.0% to $121.7 billion in April 2009. After 8-straight monthly increases to close out the year, December exports sit at $142.7 billion – almost half (49%) of the decline in exports has been regained.
Exports to China reached consecutive record highs in the last two months of 2009, ending at $8.3 billion in December. While exports overall fell 15% in 2009, exports to China in 2009 ($69.6 billion) were almost the same as they were in 2008 ($69.7 billion), putting China third behind Canada and Mexico as a destination for U.S. exports. Japan and the U.K. rounded out the top 5.
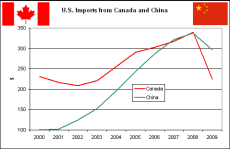
Imports from China declined 12%, from $337.8 billion in 2008 to $296.4 in 2009. Despite the drop, China retook the top spot from Canada as our largest country of origin for imported goods. Mexico was third, followed by Japan and Germany. (In 2008, Canada had narrowly edged out China based on corrections applied during our Annual Revision process.)
Share
 Yes
Yes
 No
NoComments or suggestions?


Top
