Know the Population, Every Minute, Every Day
Know the Population, Every Minute, Every Day
New Population Clock Now Embeddable and Shareable
Every 14 seconds, the U.S. Census Bureau’s population clock ticks upward. If you have ever wondered how many people are in the United States or the world, you need not look further than our website, census.gov.
While we have long provided these estimates, today our population clock got a refresh. New features now enable you to explore the richness of these data as well as download the information and share the clock via social media or embed it on your website.

The population clock has consistently been one of the most visited sites on census.gov and the data are made available thanks to the hard work of our Population Division staff. We hope you enjoy the new features and enhancements of the population clock. Its release coincides with the beginning of the Population Association of America’s annual meeting in New Orleans.
What makes the clock tick? The U.S. population clock is based on a series of short-term projections for the resident population of the United States. The clock shows you the components of population change, which are one birth every eight seconds, one death every 12 seconds and one international migrant every 44 seconds this month. These components result in our estimate of the U.S. population at any given moment.

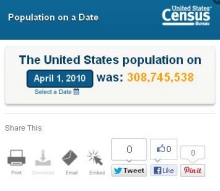
If you are interested in learning what the population was on a particular date over the past three years, you can look that up, too. For example, you can see the 2010 Census population on April 1, 2010, was 308,745,538. You can look up every day since then, allowing you to learn the population on your birthday last year or at the time of other significant U.S. and world events.
Not only can you view the current estimated U.S. population, you can also see the world population clock and learn the populations of the 10 most populous countries as well as where the U.S. ranks among them. China, which ranks first on the list, will have a July 1, 2013, population of 1,349,585,838. The data for this tool are drawn from the International Data Base (IDB ), which offers additional demographic information for each country.
Are you curious about a particular area of the United States? You can also explore how the U.S. population has changed by region since 2000 with an interactive graphic showing the growth or decline of the Northeast, Midwest, West and South. Another interactive feature is the animated U.S. population pyramid, which shows the percentage of men and women for every year of age up to 100 from 2000 to 2011.
The new population clock is embeddable, allowing you to put it on your website. You can also share it on popular social media sites such as Facebook and Twitter. As we join the statistical community in recognizing the International Year of Statistics in 2013, our new population clock shows how these statistics touch all of us. The clock is also just one example of how we are continuing our digital transformation to make our statistics more accessible for everyone.


