How Good was the 2010 Census? A View from the Post-Enumeration Survey
How Good was the 2010 Census? A View from the Post-Enumeration Survey
Last week, the Census Bureau released the results of our post-enumeration survey, called “Census Coverage Measurement (CCM).” The results showed that the 2010 Census had a net overcount of 0.01 percent, meaning about 36,000 people were overcounted in the census on the base of over 300 million. This sample-based result, however, was not statistically different from zero, after taking into account the sampling variability of the post-enumeration survey.
On this one evaluation — the net undercount of the total population — I can honestly say this was an outstanding census. When this fact is added to prior positive evaluations I’ve previously described (for example, here and here), the American public can be proud of the 2010 Census their participation made possible.
It is also useful to look at other censuses and ask the question: how is this country doing in measuring its population using the tools we have?
The graph below compares the net coverage estimates of each U.S. census since 1980 to the corresponding census of three other nations — Canada, Australia and the United Kingdom.
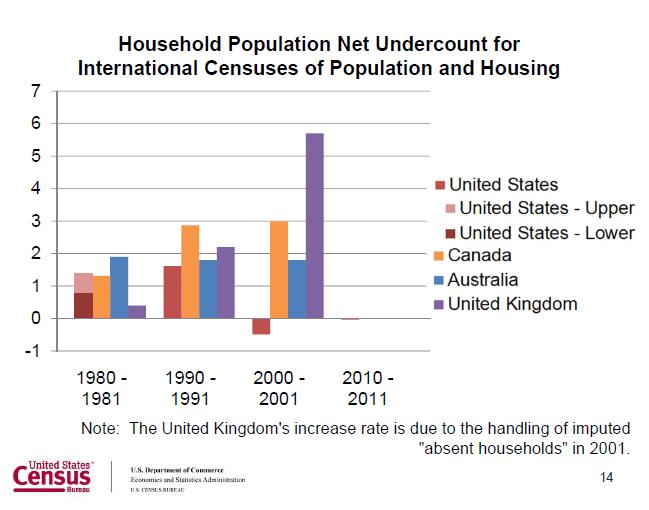
On the right, you see the very small number (an overcount of 0.01 percent) that we just announced from the 2010 U.S. Census. (We don’t yet have equivalent figures from other countries.) It is easy to look at this chart and feel proud as a resident of the United States about the historical quality of censuses that we do in this country. We do world class censuses in the United States. We will see how things compare for the 2010/2011 round, but we like this chart.
However, the net undercount is only one evaluation tool. We recognize that like other countries, there are still some groups that we have a harder time counting, for example, renters, young children, young adult males, blacks, Hispanics and American Indians on reservations. Correspondingly, we tend to overcount owners of homes, older persons, females, and White non-Hispanics. These historic patterns of systematic coverage tendencies still appear, but some of them are better than others.
We designed the post-enumeration survey to measure components of coverage. We’re just beginning to mine the data to see what operations have positive and negative influences on the quality of the census.
A few initial observations:
- In the areas where we mailed a bilingual English/Spanish form, it appears to have reduced the undercount of Hispanics relative to other populations.
- Some things done in the census intended to count people only once (such as instructions provided on the form as to who to count and not count or address listing operations intended to avoid address duplication) didn’t have the impact we had hoped, as evidenced by the higher number of duplicates in the 2010 Census.
- When people self-respond, especially early on (in this case by mail), it leads to more accurate results.
- Households that yield interviews in the face-to-face followup stage, especially those with proxy responses from neighbors, yield less accurate data.
A critical question these results raise is “Can we redesign our efforts to followup the nonrespondents to make them more efficient?” We’re seeking to do a more cost-efficient Census while producing the same high quality results. For example, we’ve committed to use the Internet as a response option and are exploring the use of administrative records to supplement our nonresponse follow-up operation. We’re also looking at ways to target our address list development activities so that we don’t have to canvass the entire country. These three options would allow us to do a chunk of the census at a lower cost so we can focus some of those saved resources on areas and hard-to-count populations that need more focused attention.
There is much more work we have to do to extract the full value of the post-enumeration survey for future censuses. As with all of our evaluations, we’ll publish them on our website, both the good news and the bad news.