New Evaluations of the 2010 Census
New Evaluations of the 2010 Census
We held a press conference to review latest updates on evaluating the 2010 Census. As usual we separated our remarks into process indicators (how well the data collection went), from comparisons of different ways to estimate the population, from the post-enumeration survey (the large sample survey designed to measure how many were missed or double counted in the census).
We now have final rates of what portion of the paper questionnaires were completed by those given them. We call this the “return rate,” whose numerator is all returned questionnaires, and the denominator is all units that were occupied (and thus eligible to return a questionnaire). (Some addresses were vacant; some were erroneously on our lists and thus are eliminated from the denominator).
The country did marginally better in 2010 than they did in 2000, as the chart below shows.
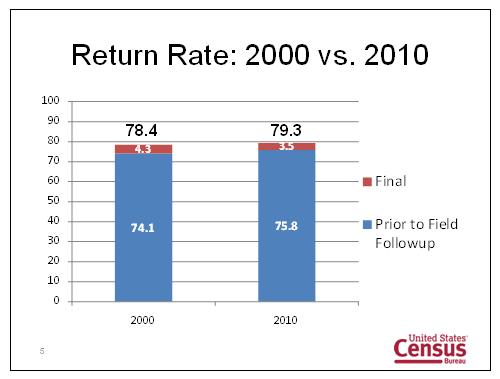
Survey researchers will know that participation in surveys have been declining over the last 10 years and this result is a rare and positive one. What made it happen? We don’t know for sure (given the lack of randomized experiments) but here are four possibilities: a) in 2010 we sent out only a 10-question short form; in 2000 5/6 of the population got the short form and 1/6 received a “long form,” which generated about a 9 percentage point lower rate, b) in 2010 there was a replacement form sent out after the initial form; this appeared to increase the return rate by 2.3 percentage points; c) we used a bilingual form in areas of high concentration of Spanish-speakers; this appeared to increase rates by about 2 percentage points in those areas; and, finally, although we don’t have empirical data on this, d) the partnership and advertising program seem in the judgment of most to be more successful this decade.
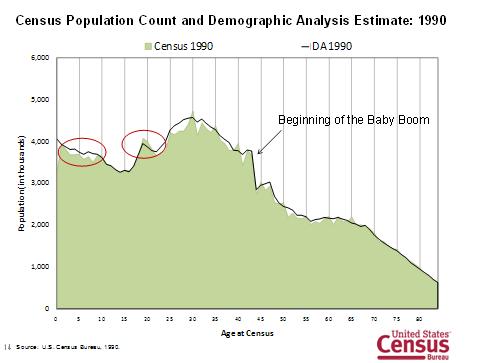
We also revealed age-specific comparisons of the 2010 Census with population estimates based on demographic analysis. We reported some initial findings in December showing similar national totals for the two methods. Recall that demographic analysis, for those 0-64 years old, uses birth and death records, counts of military overseas, and estimates of net international migration. For those 65 and older, it uses Medicare enrollment and an estimate of those not enrolled in Medicare.
We presented figures for 1990, 2000, and 2010. The horizontal axis is based on one-year age groups; the vertical axis is the total population in thousands. The colored heights are the 1990 Census counts; the black line is the population size estimate from demographic analysis. In 1990 three features are notable: a) higher demographic analysis estimates for those 0-10 years old; b) higher census counts for the late teens, and c) peaks in age reporting for the census but smoother patterns for the demographic analysis (this reflects the long-known tendency for people to round to 5’s and 10’s in reporting their age).
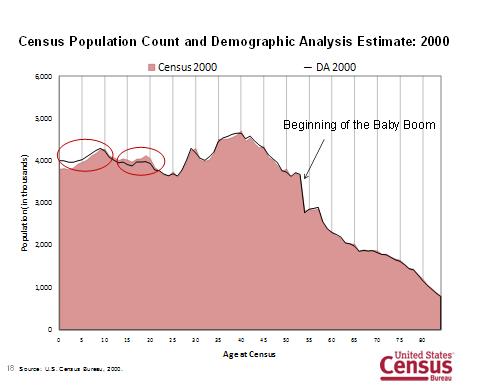
For the year 2000, there are similar contrasts between the census and demographic analysis.
Then, finally, the 2010 contrast shows a thicker line for the demographic analysis, reflecting the new reporting of uncertainty in those estimate (due principally to uncertainty about the net international migration estimates). This census also show differences between the two ways of estimating the population in the 55-67 year old group.
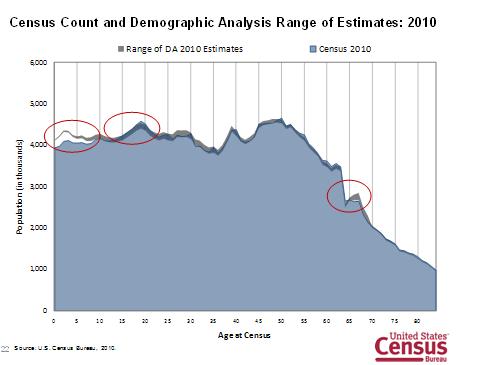
Our demographers are not surprised, therefore, by the contrasts in the 0-10 year old group (where most researchers would prefer the demographic analysis counts because of the strong birth record system in the US) and the late teen group (where we are concerned with threats of duplicates in the Census multiple places associable with the person). They are examining the results for the 55-67 age group intensively now, examining both demographic analysis and the census to detect possible reasons for the differences. (Medicare enrollment rates are being re-examined, for example.)
More evaluations will follow. I’ll report on them. The post-enumeration survey results are due in mid-2012.