Emergency Management and Preparedness: How Our Data Helps Communities in Times of Need
Emergency Management and Preparedness: How Our Data Helps Communities in Times of Need
Note: This blog was updated at 9:30 a.m. on February 11, 2025.
As the nation prepares for the 2024 hurricane season, the U.S. Census Bureau is ready to provide critical information for all stages of disaster management. This year, the National Oceanic and Atmospheric Administration’s (NOAA) National Weather Service forecasters at the Climate Prediction Center predict above-normal hurricane activity in the Atlantic basin.
Every year, to help communities prepare for possible disasters, we like to remind our users about the data tools our agency has that can help communities in their time of need. And just like last year, I now want to share how the Census Bureau provides data on where vulnerable populations live via our many tools. Once an event occurs, we combine housing, population and business data generated by the Census Bureau with data from other government agencies such as NOAA, the Economic Development Administration (EDA) and the Federal Emergency Management Agency (FEMA) to understand the demographic and economic characteristics of hard-hit areas to help ensure more targeted and equitable response and recovery efforts.
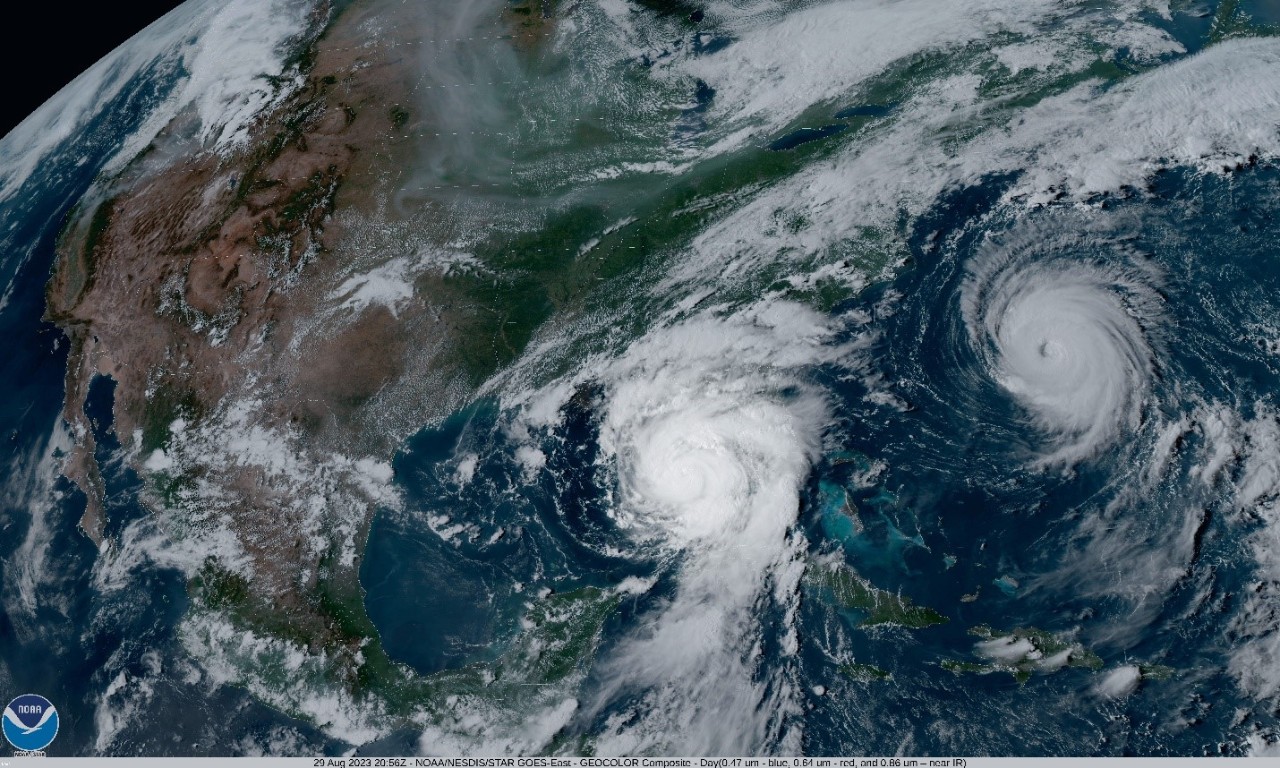
From NOAA.gov: NOAA's GOES-16 satellite captured Hurricane Idalia approaching the western coast of Florida while Hurricane Franklin churned in the Atlantic Ocean at 5:01 p.m. EDT on August 29, 2023.
Disaster Preparedness
The Census Bureau has broadened its tools to produce more information and insights to respond to disasters. An important part of disaster preparation and risk mitigation is building resilient communities. Community resilience is a measure of the capacity of individuals and households within a community to absorb, endure and recover from the external stresses of a disaster. And research shows that resilience can be predicted by individual and household characteristics.
Community Resilience Estimates
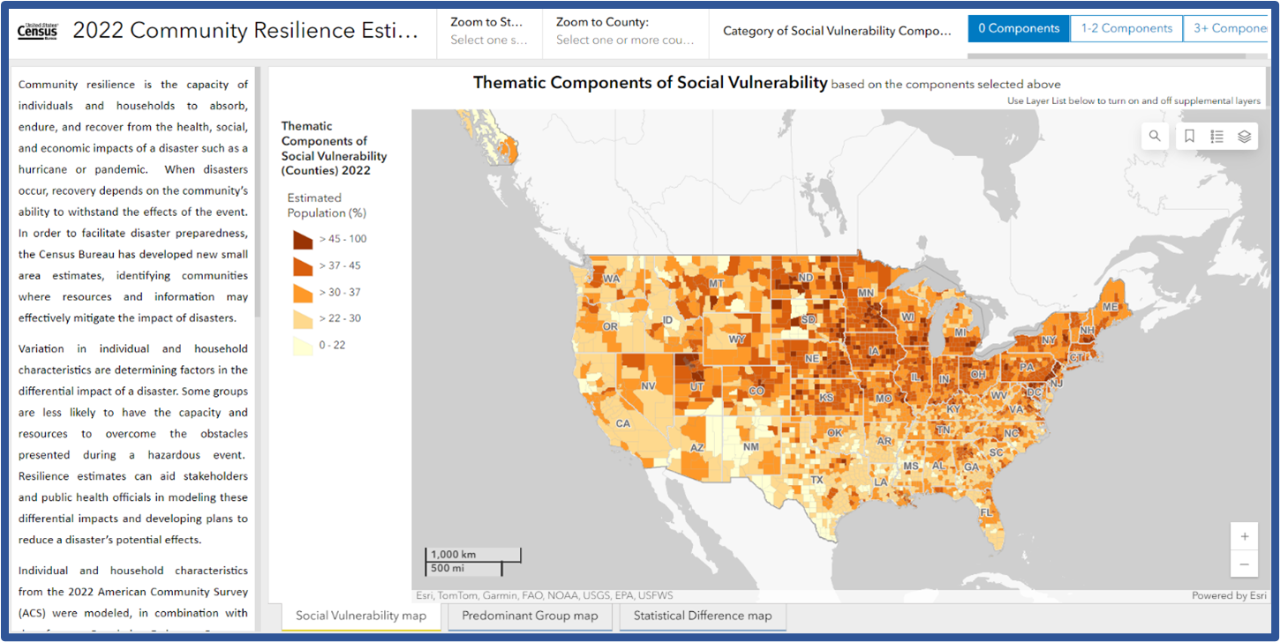
In 2020, we created an interactive tool called the Community Resilience Estimates (CRE) that measures a community’s ability to bounce back from a disaster. The idea behind the CRE is that different communities will fare differently during extreme events depending on individual and household characteristics within the community. The estimates use risk factors to model resilience such as income to poverty ratio, number of adults in a household, number of people in a household, communication barriers, education level, employment status, disability characteristics, health insurance status, age, vehicle access and broadband internet access. While other entities produce similar metrics, they are based on publicly available data. Our estimates are based on our full suite of information increasing the reliability of our numbers for rural and other areas not typically represented well in other datasets.
Community Resilience Estimates tool on Census.gov
Disaster, Response and Recovery
When a storm is approaching or after a disaster occurs, concern shifts to response and recovery. Combining our data on people and business with weather, fire and other disaster-related data via GIS (Geographic Information System) provides a trove of data and tools that zero in on the people, businesses and workers in impacted areas.
My Community Explorer
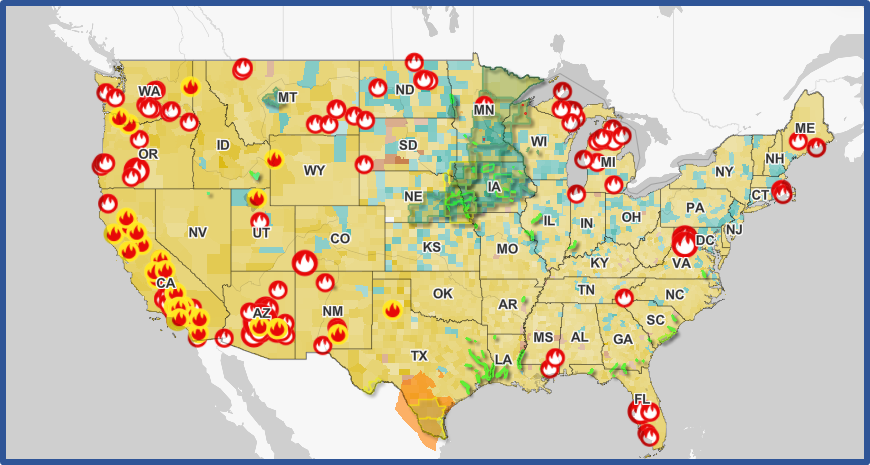
Map shows current disaster (as of May 21, 2024)
When users come to My Community Explorer, they see the real time disaster feeds for events such as hurricanes, wildfires, floods, poor air quality and extreme heat. This allows them to see the relationship of disasters to resilience and underserved communities.
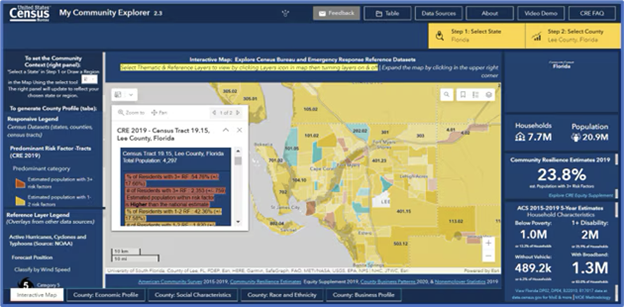
My Community Explorer tool on Census.gov
My Community Explorer (MCE) is an interactive map-based tool that highlights demographic and socioeconomic data to help understand the potential impact of disasters to people, businesses, and the economy. We can pinpoint specific census tracts at the highest risk of adverse outcomes from a disaster. In addition to the resilience estimates, the MCE includes detailed characteristics of people and businesses and flexible tools to allow users to explore the data.
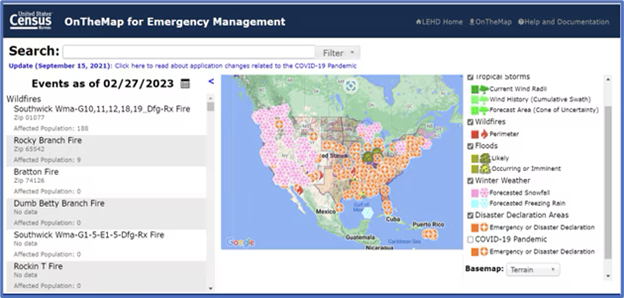
OnTheMap for Emergency Management
OnTheMap for Emergency Management tool on Census.gov
OnTheMap for Emergency Management allows users to view an automated feed of most types of disasters currently impacting the United States with underlying Census Bureau data. It incorporates information on the nation’s workforce from the Census Bureau Longitudinal Employer Household Dynamics (LEHD) program based on Unemployment Insurance wage data we receive from all 50 states, the District of Columbia and Puerto Rico.
All these tools and more are available on our Emergency Management Hub, disasters.census.gov for community leaders, researchers, academics and emergency responders to use when disaster strikes and, perhaps more importantly, when it’s time to rebuild.
Moving Forward
We are proud of the work our exceptional staff does and will continue to transform our data, tools and skills to be of even greater service in the future. We understand quality data is vital in helping communities prepare, respond and recover. Our work is essential to the public, especially in times of need – and we hope to continue being the leaders in statistics for the American public.


