
Official websites use .gov
A .gov website belongs to an official government organization in the United States.
Secure .gov websites use HTTPS
A lock (
) or https:// means you’ve safely connected to the .gov website. Share sensitive information only on official, secure websites.

Topics
Data & Maps
Surveys & Programs
Resource Library
U.S. Mover Rate Remains Stable at About 12 Percent Since 2008, Census Bureau Reports

For Immediate Release: Wednesday, March 18, 2015
U.S. Mover Rate Remains Stable at About 12 Percent Since 2008, Census Bureau Reports
Press Release Number CB15-47
About 1 in 9 People Changed Residences Between 2013 and 2014

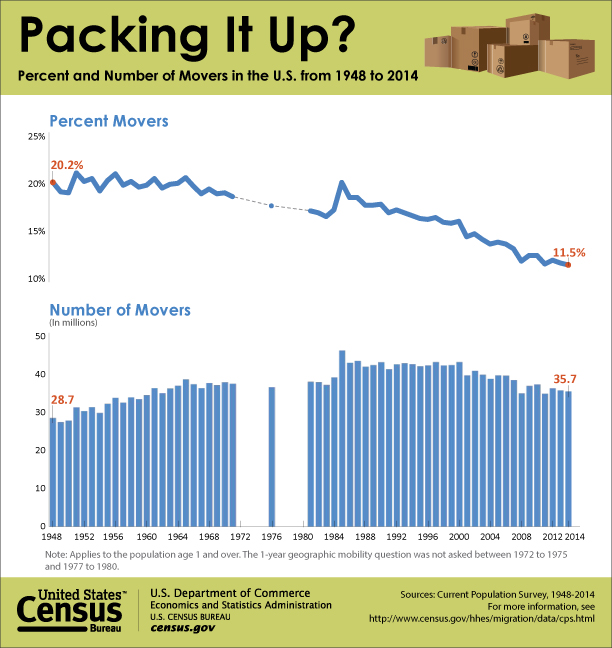
For the past several years, the mover rate has remained between 11.5 and 12.5 percent, according to new 2014 statistics released today from the U.S. Census Bureau. The mover rate between 2013 and 2014 was 11.5 percent or 35.7 million people age 1 year and over.
“When the Current Population Survey started collecting migration information in 1948, about one-in-five people moved over a one-year period,” said David Ihrke, a demographer with the Census Bureau’s Journey-to-Work and Migration Statistics Branch. “Today, that number has fallen to about one in nine.”
This information comes from Geographical Mobility: 2013 to 2014, a collection of national- and regional-level tables from the Annual Social and Economic Supplement of the Current Population Survey. The tables describe the movement of people in the United States, including type of move, reason for moving and characteristics of those who moved one year earlier. Distance moved is also available for people who moved to a different county or state.
Between 2013 and 2014:
- Movement to the suburbs continued: The suburbs had a net gain of 2.2 million movers, while principal cities had a net loss of 1.7 million.
- Renters continued to move at high rates: 24.5 percent of all people living in renter-occupied housing units lived elsewhere one-year prior. The mover rate of all people living in owner-occupied housing units was 5.0 percent.
- New job or job transfer was the highest job-related reason for moving at 9.7 percent.
Young Adult Migration

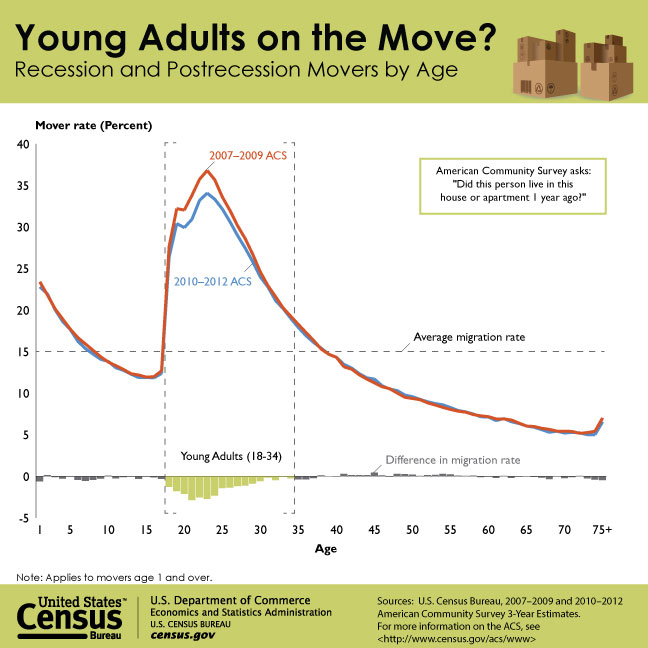
In addition to the statistics released today from the Current Population Survey, the Census Bureau also released an American Community Survey report titled Young Adult Migration: 2007-2009 to 2010-2012, which looks at 18 to 34-year-olds who moved.
The report shows that the migration of young adults declined 1.4 percentage points during the postrecession period. While young adults are still the largest migrant group, much of the decline in migration at the national level between 2006 and 2009 has been because of the decline in the movement of this age group, according to the ACS.
“The two releases and surveys conducted by the Census Bureau provide a detailed picture of migration in the United States,” said Megan Benetsky, an analyst with the Census Bureau’s Journey-to-Work and Migration Statistics Branch and one of the report’s authors. “Migration statistics from the Current Population Survey give us a national view, while the American Community Survey allows us to focus on smaller geographies and more specifically provides the only detailed information available on small population groups, like young adults, at lower levels of geography.”
The American Community Survey report describes the demographic and socio-economic status of movers ages 18 to 34 using data collected from 2007 to 2009 and from 2010 to 2012.
During the postrecession period:
- The migration rate of adults ages 18-34 declined by 1.4 percentage points, while the rate for older adults stayed relatively steady.
- Females 18 to 24 years old had a higher rate of migration than males of the same age (32.4 percent compared with 29.8 percent), but among 25- to 29-year-olds and 30- to 34-year-olds, the pattern reversed, and males were more likely to migrate than females (29.5 percent compared with 28.6 percent, and 22.5 percent compared with 20.4 percent, respectively).
- Non-Hispanics were more likely to migrate than Hispanics. This is especially apparent in the 18- to 24-year-old age group, where 32.9 percent of non-Hispanics migrated in the last year compared with 24.2 percent of Hispanics.
- Employed individuals were least likely to move. Compared with other young adults, those age 30 to 34 who were employed had the lowest migration rate (20.1 percent).
The report provides additional detail about young adult migration for metropolitan areas, which can be accessed via census.gov.
-X-
Data in this report are subject to sampling variability as well as nonsampling errors. Sources of nonsampling errors include errors of response, nonreporting and coverage.
Statistics from sample surveys are subject to sampling and nonsampling error. All comparisons made in this report have been tested and found to be statistically significant at the 90 percent confidence level, unless otherwise noted. Please consult the tables for specific margins of error. For more information, go to www.census.gov/programs-surveys/acs/technical-documentation.html. See www.census.gov/programs-surveys/acs/technical-documentation/table-and-geography-changes.2012.html for more information on changes affecting the 2012 statistics. See
Contact


Page Last Revised - October 8, 2021
✕
Is this page helpful?
 Yes
Yes
 No
No
 Yes
Yes
 No
No✕
NO THANKS
255 characters maximum
 255 characters maximum reached
✕
Thank you for your feedback.
Comments or suggestions?

Comments or suggestions?