
Official websites use .gov
A .gov website belongs to an official government organization in the United States.
Secure .gov websites use HTTPS
A lock (
) or https:// means you’ve safely connected to the .gov website. Share sensitive information only on official, secure websites.

Topics
Data & Maps
Surveys & Programs
Resource Library

For Immediate Release: Wednesday, February 26, 2014
Census Bureau Highlights Young Noncitizen Population in the U.S.
Press Release Number CB14-34

More than three out of five noncitizens under age 35 have been in the U.S. for five years or more, with a majority coming before they were 18 years old, according to a new brief released today from the U.S. Census Bureau. Most of these immigrants — about 80 percent — were young adults from 18 to 34.
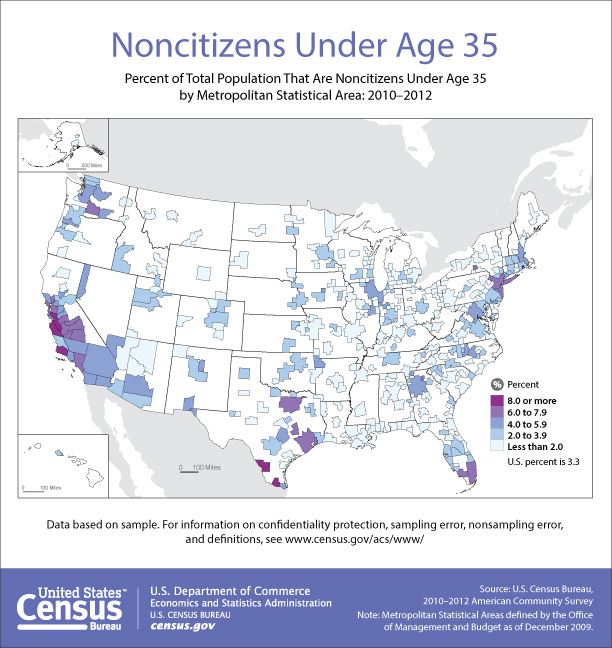
The brief Noncitizens Under Age 35: 2010-2012 uses multiyear data from the American Community Survey to present demographic and socio-economic information about the noncitizen population under age 35. Noncitizens include legal permanent residents, temporary migrants, unauthorized immigrants and other resident statuses. The American Community Survey does not include a question on legal status of a resident; therefore, the brief compares only the characteristics of citizens with noncitizens.
"This brief gives an overview of some common characteristics of the younger noncitizen population," said Elizabeth Grieco, chief of the Census Bureau's Foreign-Born Population Branch. "The statistics provide new insight into the composition of this unique group."
School Enrollment
Almost one-third of the 2.6 million noncitizens age 18 to 24 living in the U.S. were enrolled in college. Among 18- to 24-year-old noncitizens born in Asia, 65 percent were enrolled in college, followed by those born in Europe (54 percent), Africa (54 percent) and the Latin America and Caribbean region (18 percent).
Geographic Distribution and Region of Birth
Nationwide, noncitizens under age 35 represented about one-fourth (26 percent) of the total foreign-born population. At the state level, this proportion varied from about one out of five (18 percent) to two out of five (41 percent). Traditional immigration gateway states like California, Texas, New York and Florida account for the majority of noncitizens under 35.
More than 64 percent of the 10.3 million noncitizens in the U.S. under the age of 35 were born in Latin America and the Caribbean. Asia (23 percent) made up the second highest group of under age 35 noncitizens in the U.S., followed by Europe (6 percent).
Other findings include:
- California had 2.3 million noncitizens under age 35, the most of any state. Following California were Texas (1.3 million), New York (916,000), Florida (747,000) and Illinois (450,000).
- Metropolitan areas with the largest number of noncitizens under age 35 included New York (1.2 million) and Los Angeles (927,000), with Chicago, Dallas, Houston and Miami all at about 400,000.
Labor Force
Among the civilian population, citizens age 25 to 34 (83 percent) were more likely than noncitizens of the same age range (75 percent) to be in the labor force. In addition, of those in the labor force, 65 percent of citizens compared with 60 percent of noncitizens were employed full time, year-round.
Other findings include:
- Noncitizens in the civilian labor force age 25 to 34 were more likely to work in service occupations (27 percent); followed by management, business, science and arts occupations (25 percent); and natural resources, construction and maintenance occupations (20 percent).
- Citizens in the civilian labor force age 25 to 34 were more likely to work in management, business, science and arts occupations (39 percent); sales and office occupations (25 percent); and service occupations (18 percent).
About the American Community Survey
The American Community Survey provides a wide range of important statistics about all communities in the country. The American Community Survey gives communities the current information they need to plan investments and services. Retailers, homebuilders, police departments, and town and city planners are among the many private- and public-sector decision makers who count on these annual results.
Ever since Thomas Jefferson directed the first census in 1790, the census has collected detailed characteristics about our nation's people. Questions about jobs and the economy were added 20 years later under James Madison, who said [PDF - 3.9 MB] such information would allow Congress to "adapt the public measures to the particular circumstances of the community," and over the decades allow America "an opportunity of marking the progress of the society."
-X-
Note: Statistics from sample surveys are subject to sampling and nonsampling error. All comparisons made in this report have been tested and found to be statistically significant at the 90 percent confidence level, unless otherwise noted. Please consult the tables for specific margins of error. For more information, go to <//www.census.gov/acs/www/data_documentation/documentation_main/>.
See <//www.census.gov/acs/www/data_documentation/2012_release/> for more information on changes affecting the 2010 — 2012 statistics. See <//www.census.gov/acs/www/guidance_for_data_users/comparing_2012/> for guidance on comparing 2010 — 2012 American Community Survey statistics with previous years.
Contact
Brian Lavin
Public Information Office
301-763-3030
pio@census.gov


Page Last Revised - December 16, 2021
✕
Is this page helpful?
 Yes
Yes
 No
No
 Yes
Yes
 No
No✕
NO THANKS
255 characters maximum
 255 characters maximum reached
✕
Thank you for your feedback.
Comments or suggestions?

Comments or suggestions?