
Official websites use .gov
A .gov website belongs to an official government organization in the United States.
Secure .gov websites use HTTPS
A lock (
) or https:// means you’ve safely connected to the .gov website. Share sensitive information only on official, secure websites.

Topics
Data & Maps
Surveys & Programs
Resource Library
Census Bureau’s American Community Survey Provides New State and Local Income, Poverty, Health Insurance Statistics

For Immediate Release: Thursday, September 18, 2014
Census Bureau’s American Community Survey Provides New State and Local Income, Poverty, Health Insurance Statistics
Press Release Number CB14-170
Income levels and poverty rates were not statistically different for most states from 2012 to 2013, according to statistics released today from the U.S. Census Bureau’s American Community Survey, the nation’s most comprehensive data source on American households.
The state and local income and poverty statistics in the American Community Survey and the local-level health insurance statistics complement the national-level statistics released Tuesday from the Current Population Survey and American Community Survey. The American Community Survey has included questions about health insurance coverage since 2008, and today’s release provides statistics for all metropolitan areas and places with a population of 65,000 or more. Of metro areas, Pittsfield, Mass., had among the lowest percentage of uninsured at 2.1 percent.
“The American Community Survey is our country’s only source of small area estimates for social and demographic characteristics,” Census Bureau Director John H. Thompson said. “As such, it is indispensable to our economic competitiveness and used by businesses, local governments and anyone in need of trusted, timely, detailed data.”
The 2013 American Community Survey provides a multitude of statistics that measure the social, economic and housing conditions of U.S. communities. More than 40 topics are available with today’s release, such as educational attainment, housing, employment, commuting, language spoken at home, nativity, ancestry and selected monthly homeowner costs.
Also released today are two reports providing analysis on income and poverty for states and large metropolitan areas.
Income
According to the report Household Income: 2013, which compares American Community Survey statistics from 2012 to 2013:
- For 2013, median household incomes were lower than the U.S. median ($52,250) in 28 states and higher in 19 states and the District of Columbia. Iowa ($52,229), Pennsylvania ($52,007) and Vermont ($52,578) median household incomes did not have a statistically significant difference from the U.S. as a whole.
- In 2013, the states with the highest median household incomes were Maryland ($72,483) and Alaska ($72,237), which were not statistically different from each other. Mississippi had the lowest ($37,963).
- There were no statistically significant decreases in median household incomes among states.
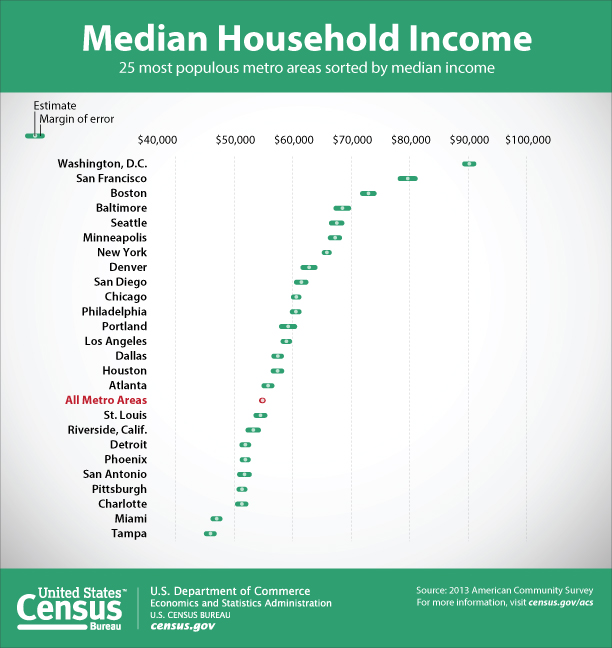
- Median household income among the 25 most populous metro areas was highest in the Washington, D.C. ($90,149), San Francisco ($79,624) and Boston ($72,907) metro areas.
Income Inequality
Household Income: 2013 also examined the Gini index for states and large metro areas. The Gini index is a summary measure of income inequality, ranging from 0 — complete equality — to 1 — complete inequality. Among the findings:
- Five states and the District of Columbia had Gini indexes higher than the U.S. index of .481.
- Thirty-six states had lower Gini indexes than the U.S. index of .481.
- The Gini index of 15 states increased from 2012 to 2013. Alaska was the only state to have a decrease. All other states saw no significant change.
- The highest Gini index was in the District of Columbia (0.532). Alaska’s (0.408) was among the lowest.
- Additional Gini index data on the Census Bureau’s American FactFinder data search engine is available for metropolitan statistical areas and other areas with populations of 65,000 or more. Of the 25 most populous metro areas, Gini indexes ranged from 0.442 (for the Washington, D.C., metro area, although not statistically different from Portland, Ore., Riverside, Calif., and Minneapolis) to 0.512 (for the New York metro area, which was not statistically different from the Miami metro area).
Poverty
According to the report Poverty: 2012 and 2013 which compares American Community Survey statistics from 2012 to 2013:
- Forty-two states and the District of Columbia experienced no statistical change in both the number and percentage of people in poverty between 2012 and 2013. Likewise, 20 of the 25 largest metropolitan areas did not see a statistical change in the number and percentage of people in poverty.
- Two states — New Hampshire and Wyoming— saw a decline in both the number and percentage of people in poverty. In terms of rates, New Hampshire’s poverty rate declined from 10.0 percent in 2012 to 8.7 percent in 2013. Wyoming’s rate declined from 12.6 percent to 10.9.
- Three states saw increases in both the number and percentage of people in poverty between 2012 and 2013. New Jersey’s poverty rate increased from 10.8 percent in 2012 to 11.4 percent in 2013; New Mexico increased from 20.8 percent to 21.9 percent, and Washington increased from 13.5 percent to 14.1 percent.
- In 2013, Mississippi had the highest poverty rate among states (24.0 percent), followed by New Mexico (21.9 percent). Both states also had the highest percentage of the population below 125 percent of the poverty level: 30.3 percent in Mississippi; 28.3 percent in New Mexico. About one in 10 people in both states had incomes less than 50 percent of the poverty level.
- Among large metropolitan areas, one of the lowest proportions of people with incomes less than 50 percent of the poverty level in 2013 was 4.2 percent in the Washington, D.C., metro area, while one of the highest proportions was 8.4 percent in the Phoenix metro area.
Health Insurance
- Between 2012 and 2013, 13 states and Puerto Rico saw a statistically significant increase in the percentage of civilians covered by health insurance. Two states (Maine and New Jersey) saw a decrease.
- The percentage of the civilian noninstitutionalized population with private health insurance increased in six states and decreased in eight states between 2012 and 2013.
- Among people whose incomes were below 138 percent of the poverty threshold: 25.6 percent were uninsured in 2013. Under the Affordable Care Act, states have the option of expanding Medicaid eligibility to those with incomes at or below 138 percent of the poverty threshold.
- Among people whose incomes were at or above 200 percent of the poverty threshold: 9.2 percent were uninsured in 2013.
- Among the top 25 largest U.S. metropolitan areas, the uninsured rates were highest in Miami (24.8 percent), Houston (22.8 percent) and Dallas (21.5 percent) and lowest in Boston (4.2 percent), Pittsburgh (7.5 percent), Minneapolis (8.1 percent) and Baltimore (8.7 percent).
- Among the top 25 large metropolitan areas, Tampa, Detroit and Riverside, Calif., had public coverage rates of 33 percent or higher.
Computer and Internet Access
The 2013 American Community Survey included new questions to produce statistics on computer and Internet access. Mandated by the 2008 Broadband Data Improvement Act, the data will help the Federal Communications Commission measure broadband access nationwide. The data will also help identify communities eligible for available grants to expand access.
Some topline findings:
- 83.8 percent of the nation’s households have a computer (either desktop, laptop, tablet or smartphone)
- 74.4 percent have some form of Internet access at home.
The Census Bureau is releasing a more detailed report on the new findings in early October.
The Census Bureau also today updated its application programming interface (API) with 2013 American Community Survey statistics. The API, which allows developers to create custom apps with Census Bureau data, now includes 2013 American Community Survey data profiles across geographies, including congressional districts.
Also Released Today from the American Community Survey:
- Annual state-to-state migration data tables (not embargoed)
- Annual same sex data tables (national level only, not embargoed)
Additional American Community Survey Results
On Oct. 23, the Census Bureau will release a set of American Community Survey statistics covering all areas with populations of 20,000 or more, based on data collected between 2011 and 2013. A third set of American Community Survey statistics, available for all geographic areas regardless of population size, down to the block group level, will be released on Dec. 4 covering 2009 to 2013.
About the American Community Survey
The American Community Survey provides a wide range of important statistics about all communities in the country. The American Community Survey gives communities the current information they need to plan investments and services. Retailers, homebuilders, police departments, and town and city planners are among the many private- and public-sector decision makers who count on these annual results. Visit the Stats in Action page to see some examples.
Ever since Thomas Jefferson directed the first census in 1790, the census has collected detailed characteristics about our nation’s people. Questions about jobs and the economy were added 20 years later under James Madison, who said [PDF 3.9 MB] such information would allow Congress to “adapt the public measures to the particular circumstances of the community,” and over the decades allow America “an opportunity of marking the progress of the society.”
These statistics would not be possible without the participation of the randomly selected households in the survey.
-X-
Note: Statistics from sample surveys are subject to sampling and nonsampling error. All comparisons made in this report have been tested and found to be statistically significant at the 90 percent confidence level, unless otherwise noted. Please consult the tables for specific margins of error. For more information, go to <www.census.gov/programs-surveys/acs/technical-documentation.html>.
Changes in survey design from year to year can affect results. See <www.census.gov/programs-surveys/acs/news/data-releases.2013.html> for more information on changes affecting the 2013 statistics. See www.census.gov/programs-surveys/acs/guidance/comparing-acs-data/2013.html> for guidance on comparing 2013 American Community Survey statistics with previous years and the 2010 Census.
Contact


Page Last Revised - April 29, 2024
✕
Is this page helpful?
 Yes
Yes
 No
No
 Yes
Yes
 No
No✕
NO THANKS
255 characters maximum
 255 characters maximum reached
✕
Thank you for your feedback.
Comments or suggestions?

Comments or suggestions?