Census Bureau Reports Majority of STEM College Graduates Do Not Work in STEM Occupations
For Immediate Release: Thursday, July 10, 2014
Census Bureau Reports Majority of STEM College Graduates Do Not Work in STEM Occupations
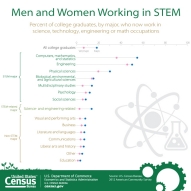
The U.S. Census Bureau reported today that 74 percent of those who have a bachelor's degree in science, technology, engineering and math — commonly referred to as STEM — are not employed in STEM occupations. In addition, men continue to be overrepresented in STEM, especially in computer and engineering occupations. About 86 percent of engineers and 74 percent of computer professionals are men.
"STEM graduates have relatively low unemployment, however these graduates are not necessarily employed in STEM occupations," said Liana Christin Landivar, a sociologist in the Census Bureau's Industry and Occupation Statistics Branch.
According to new statistics from the 2012 American Community Survey, engineering and computer, math and statistics majors had the largest share of graduates going into a STEM field with about half employed in a STEM occupation. Science majors had fewer of their graduates employed in STEM. About 26 percent of physical science majors; 15 percent of biological, environmental and agricultural sciences majors; 10 percent of psychology majors; and 7 percent of social science majors were employed in STEM.
Approximately 14 percent of engineers were women, where they were most underrepresented of all the STEM fields. Representation of women was higher among mathematicians and statisticians (45 percent), life scientists (47 percent) and social scientists (63 percent). The rates of mathematicians and statisticians, and life scientists are not statistically different from each other.
Highlights
The tables released today highlight statistics on field of degree, occupation, unemployment and median earnings for college graduates by sex, race and Hispanic origin. In addition, the tables include state level STEM occupation information. Below details a few highlights from the tables:
- At 9.1 million, the college major with the most graduates was business, while multidisciplinary studies was the major with the smallest number of graduates at 275,000.
- Engineering was the major with the highest earnings ($92,900), while the major with the lowest earnings was visual and performing arts ($50,700).
- In 2012, 3.6 percent of all college graduates between the ages of 25 and 64 were unemployed. A larger percentage of men than women were unemployed: 3.7 percent and 3.5 percent, respectively.
- Non-STEM management occupations employed the most male college graduates (3.8 million), while education occupations employed the most female college graduates (4.3 million).
- States with the largest percentage of STEM workers: Maryland (18.8 percent), Washington (18.3 percent) and Virginia (16.5 percent). The rates of workers in Maryland and Washington are not statistically different from each other.
Interactive Graphic
In addition to new tables released today on field of degree and occupation, the Census Bureau released a new interactive graphic to explore the relationship between college majors and occupations. The graphic shows the relationship between STEM college majors and STEM employment. In addition, the graphic highlights STEM and non-STEM field of degree and employment by sex, race and Hispanic origin.
About the American Community Survey
The American Community Survey provides a wide range of important statistics about all communities in the country. The American Community Survey gives communities the current information they need to plan investments and services. Retailers, homebuilders, police departments, and town and city planners are among the many private- and public-sector decision makers who count on these annual results.
Ever since Thomas Jefferson directed the first census in 1790, the census has collected detailed characteristics about our nation's people. Questions about jobs and the economy were added 20 years later under James Madison, who said such information would allow Congress to "adapt the public measures to the particular circumstances of the community," and over the decades allow America "an opportunity of marking the progress of the society."
-X-
Note: Statistics from sample surveys are subject to sampling and nonsampling error. All comparisons made in this report have been tested and found to be statistically significant at the 90 percent confidence level, unless otherwise noted. Please consult the tables for specific margins of error. For more information, go to <www.census.gov/programs-surveys/acs/technical-documentation.html>. See <www.census.gov/programs-surveys/acs/news/data-releases.2012.html> for more information on changes affecting the 2012 statistics. See <www.census.gov/programs-surveys/acs/guidance/comparing-acs-data/2012.html> for guidance on comparing 2012 American Community Survey statistics with previous years.
Unemployment estimates may vary from the official labor force data released by the Bureau of Labor Statistics because of differences in universes, survey design, and data collection. The estimates presented here are the percent unemployed among all bachelor’s degree holders aged 25 to 64 in the civilian population, including those in the labor force and not in the labor force. For more guidance on differences in unemployment estimates from different sources go to <www.census.gov/hhes/www/laborfor/laborguidance092209.html>.
The Standard Occupational Classification Policy Committee issued recommendations in April 2012 on how to define STEM occupations. Census Bureau reports and tables reflect the new recommendations. Other prior analyses, including a report [PDF] released by the U.S. Department of Commerce Economics and Statistics Administration in July 2011, have defined STEM workers in slightly different ways.


