An official website of the United States government
Here’s how you know
Official websites use .gov
A .gov website belongs to an official government organization in the United States.
Secure .gov websites use HTTPS
A lock (
) or https:// means you’ve safely connected to the .gov website. Share sensitive information only on official, secure websites.
-
//
- Census.gov /
- Library /
- Census Working Papers /
- The Foreign-Born Population by U.S. Region, 1850-2016
The Foreign-Born Population by U.S. Region, 1850-2016
The Foreign-Born Population by U.S. Region, 1850-2016
Introduction
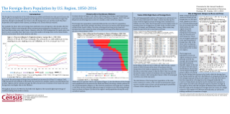
Over time, the composition and geographic distribution of the foreign-born population in the United States has changed considerably. In 2016, the share of foreign born in the U.S. population was 13.5 percent, the highest it had been since 1910. From 1850 to 2016, each U.S. region (Northeast, Midwest, South, West) and historical period attracted a unique mix of migrants. For example, there were foreign-born groups in both 1910 and 2010 that appeared in only a single region’s top five foreign places of birth. Moreover, no country of origin listed among the top five foreign-born groups in a given region in 1910 ranked among the top five countries of origin in any U.S. region in 2010, with the exception of the Mexican-born population in the South. In addition to these regional trends, the states with the highest percentages of foreign born fluctuated. Many states with relatively low percentages of foreign-born residents in 2016 were once the states with the highest. This poster will present text, tables, and figures to highlight the regional- and state-level changes in the composition and geographic distribution of the U.S. foreign-born population from 1850 to 2016.
Share
Related Information
Some content on this site is available in several different electronic formats. Some of the files may require a plug-in or additional software to view.
 Yes
Yes
 No
NoComments or suggestions?


Top

