The Intersection of Poverty and Income Inequality in Metropolitan Statistical Areas (MSAs): 2005 to 2015
The Intersection of Poverty and Income Inequality in Metropolitan Statistical Areas (MSAs): 2005 to 2015
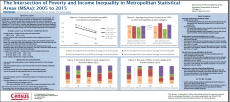
I use the 2005 and 2015 American Community Surveys to calculate an average poverty rate and average income inequality for both the 50-10 ratio and the 90-50 ratio in MSAs for 2005 and 2015. Then I classified these MSAs based on whether poverty in the area was above average or below average and whether income inequality in the area was above average or below average. I divided MSAs into four different categories: above average poverty and above average income inequality, below average poverty and below average income inequality, above average poverty and below average income inequality, and below average poverty and above average income inequality.
I did three main things with this data. First, I examined the correlations between the 50-10 ratio and the poverty rate, the 90-50 ratio and the poverty rate, and the 50-10 ratio and the 90-50 ratio in both 2005 and 2015. This shows how strong the relationship is between poverty and income inequality and how that relationship changed over time. Second, I examined how population growth for 2005 to 2015 differs in MSAs in each of the four created poverty/income inequality categories. This shows the types of MSAs in which populations are growing fastest. Third, I examined the mix of poverty/income inequality categories in the U.S. and among the four regions in the U.S. in 2015. This shows the geographical distribution of poverty and income inequality.


