An official website of the United States government
Here’s how you know
Official websites use .gov
A .gov website belongs to an official government organization in the United States.
Secure .gov websites use HTTPS
A lock (
) or https:// means you’ve safely connected to the .gov website. Share sensitive information only on official, secure websites.
-
//
- Census.gov /
- Library /
- Census Working Papers /
- Income Inequality Metrics and Economic Well-being
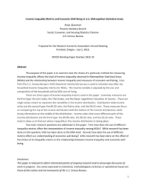
Income Inequality Metrics and Economic Well-being in U.S. Metropolitan Statistical Areas
Income Inequality Metrics and Economic Well-being in U.S. Metropolitan Statistical Areas
Introduction
The purpose of this paper is to examine how the choice of a particular method for measuring income inequality affects the level of income inequality observed in Metropolitan Statistical Areas (MSAs) and the relationship between income inequality and measures of economic well-being. Data from the U.S. Census Bureau’s 2014 American Community Survey is used to calculate nine after-tax household income inequality metrics for MSAs. The income variable is adjusted by the size and composition of the household and by MSA cost of living.
There are three types of income inequality metrics used in this paper. Summary measures are the first type: the Gini Index, the Theil Index, and the Mean Logarithmic Deviation of Income. These are single values meant to represent the variability in the income distribution. Distribution-wide income ratios are the second type: the 80:20 ratio, the Palma ratio, and the 90:10 ratio. These measures focus on comparing the top of the income distribution with the bottom of the income distribution, while losing information on the middle of the distribution. Income ratios that cover different parts of the income distribution are the third type: the 99:90 ratio, the 90:50 ratio, and the 50:10 ratio. These metrics allow us to find out where inequality in the income distribution is taking place.
Two main research questions are addressed in this paper. First, how does the use of different inequality metrics affect the interpretation of income inequality among MSAs? While research has been done on this question, little has been done at the MSA level. Second, how does the use of different metrics affect our understanding of economic well-being? Little research has been done on the effect of the choice of an inequality metric on the relationships between income inequality and economic well-being.
Share
Related Information
WORKING PAPER
Poverty Working PapersSome content on this site is available in several different electronic formats. Some of the files may require a plug-in or additional software to view.
 Yes
Yes
 No
NoComments or suggestions?


Top


