
Official websites use .gov
A .gov website belongs to an official government organization in the United States.
Secure .gov websites use HTTPS
A lock (
) or https:// means you’ve safely connected to the .gov website. Share sensitive information only on official, secure websites.

Topics
Data & Maps
Surveys & Programs
Resource Library
Select Maps on the Population 65 and Older in the United States by County: 2013-2017
Select Maps on the Population 65 and Older in the United States by County: 2013-2017
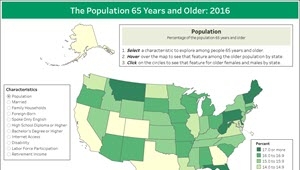
This series contains select maps on the Population 65 and Older in the United States by County: 2013-2017
This county-level map series presents geographic patterns in the population aged 65 and older, with a focus on disability. Data come from the 2013-2017 American Community Survey 5-year estimates. The maps show distribution of the older population and prevalence of disability combined with select characteristics. Indicators include living alone, widowhood, poverty status, and labor force participation, and compare the total older population with those with a disability. This map series also showcases dot density maps that illustrate population distribution of the older population and the disabled older population in the United States.

Related Information

Page Last Revised - October 8, 2021
✕
Is this page helpful?
 Yes
Yes
 No
No
 Yes
Yes
 No
No✕
NO THANKS
255 characters maximum
 255 characters maximum reached
✕
Thank you for your feedback.
Comments or suggestions?

Comments or suggestions?