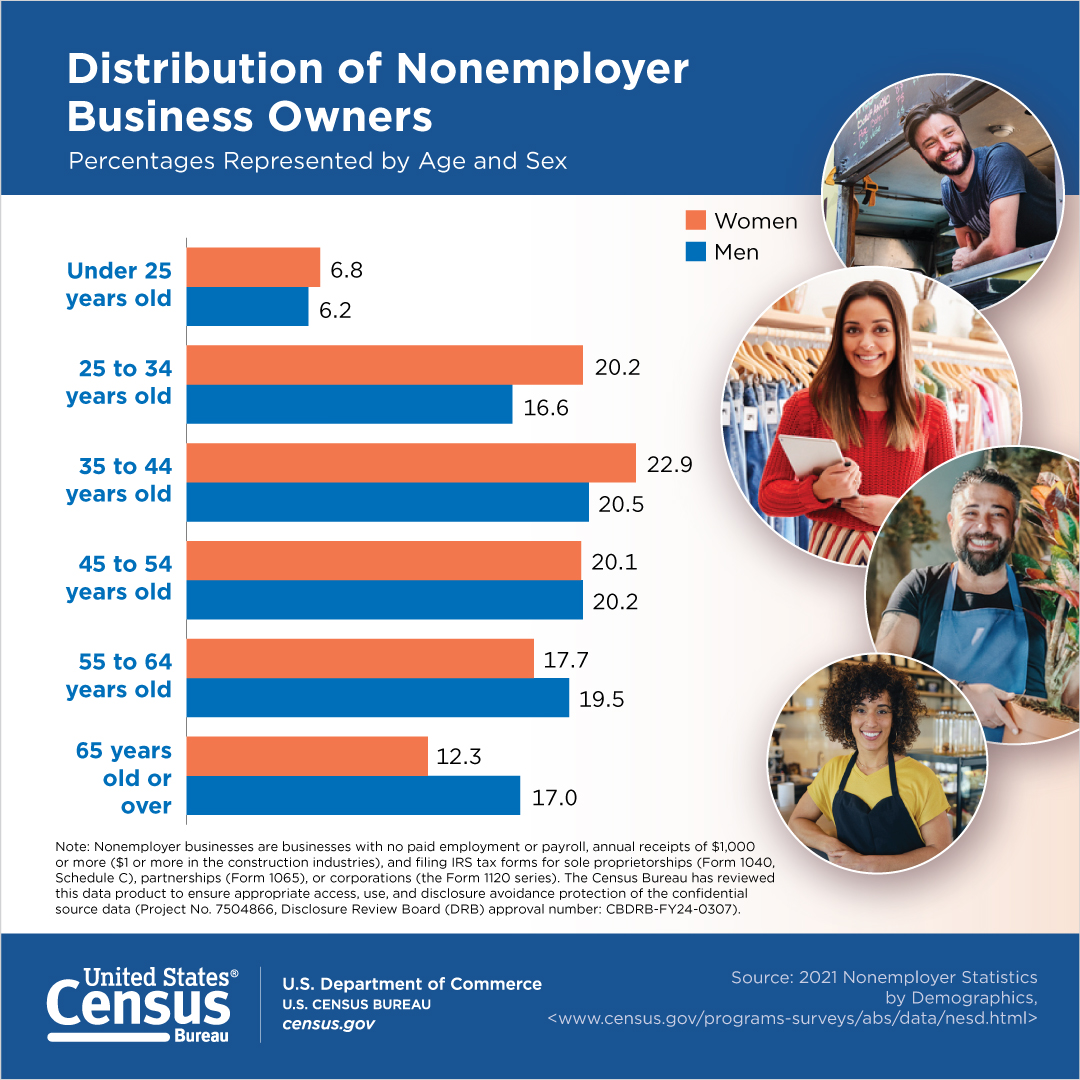
Distribution of Nonemployer Business Owners

Download or Print this Graphic:


Note: Nonemployer businesses are businesses with no paid employment or payroll, annual receipts of $1,000 or more ($1 or more in the construction industries), and filing IRS tax forms for sole proprietorships (Form 1040, Schedule C), partnerships (Form 1065), or corporations (the Form 1120 series). The Census Bureau has reviewed this data product to ensure appropriate access, use, and disclosure avoidance protection of the confidential source data (Project No. 7504866, Disclosure Review Board (DRB) approval number: CBDRB-FY24-0307).
Source: 2021 Nonemployer Statistics by Demographics, <www.census.gov/programs-surveys/abs/data/nesd.html>
Page Last Revised - August 8, 2024