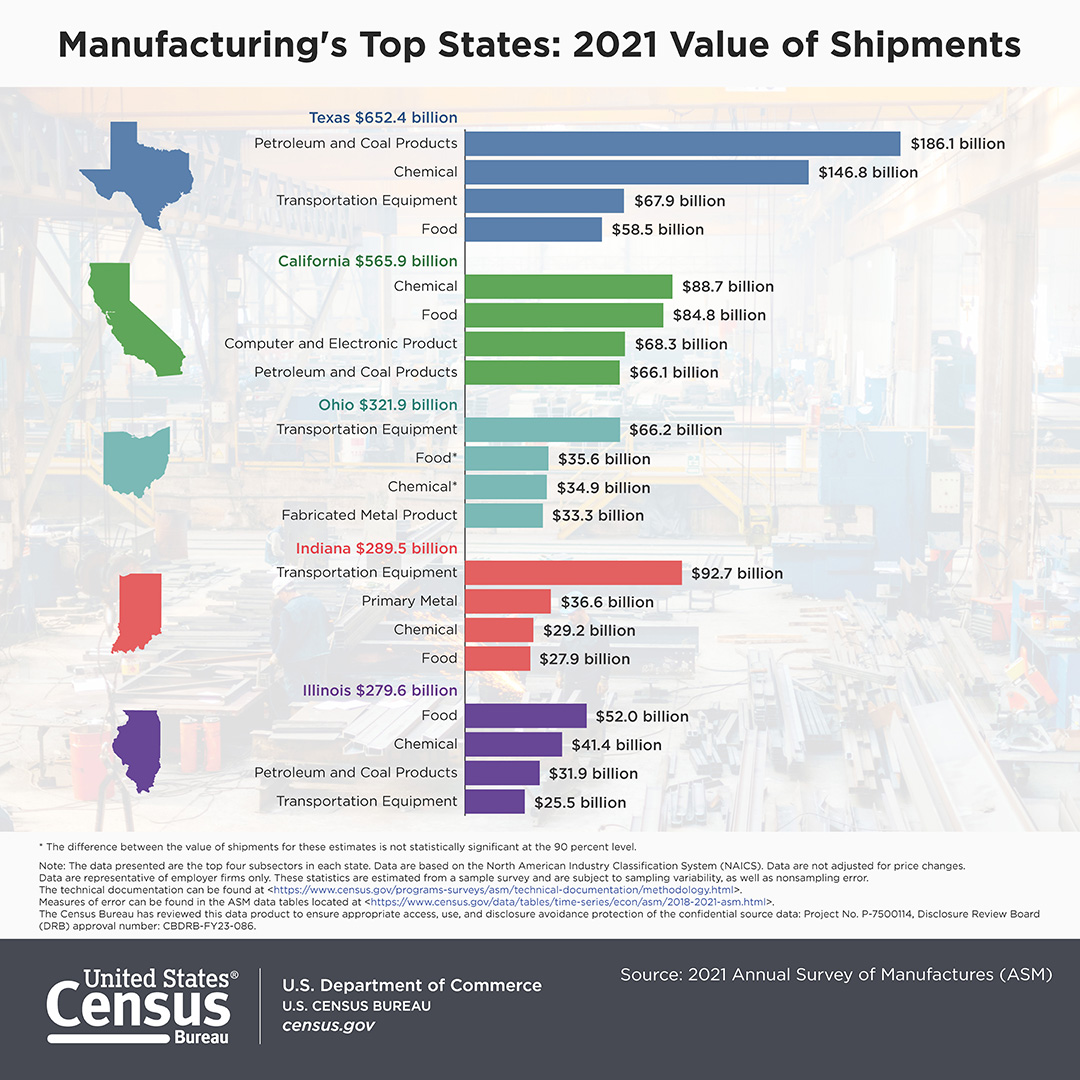
Manufacturing's Top States: 2021 Value of Shipments

Download or Print this Graphic:


* The difference between the value of shipments for these estimates is not statistically significant at the 90 percent level.
Source:
2021 Annual Survey of Manufactures (ASM)
Note:
The data presented are the top four subsectors in each state. Data are based on the North American Industry Classification System (NAICS). Data are not adjusted for price changes.
Data are representative of employer firms only. These statistics are estimated from a sample survey and are subject to sampling variability, as well as nonsampling error.
The technical documentation can be found at <https://www.census.gov/programs-surveys/asm/technical-documentation/methodology.html>.
Measures of error can be found in the ASM data tables located at <https://www.census.gov/data/tables/time-series/econ/asm/2018-2021-asm.html>.
The Census Bureau has reviewed this data product to ensure appropriate access, use, and disclosure avoidance protection of the confidential source data: Project No. P-7500114, Disclosure Review Board
(DRB) approval number: CBDRB-FY23-086.